AI timeline generator: Best B2B Workflow for Teams
Compare ai timeline generator approaches to build polished, on-brand timelines from raw content in minutes, helping your team publish faster. Discover how!

AI Timeline Generator: The B2B Playbook for Content Teams
You have the data. It’s sitting in a messy spreadsheet, a 30-comment Google Doc thread, or maybe just a long-winded email from the product team. It’s the Q1 launch plan, the multi-stage customer journey, the history of your company’s biggest milestones. You know this would make a killer visual for the next board meeting, sales kickoff, or blog post.
And you also know what comes next.
You try to wrangle it into a PowerPoint slide, but it looks… clumsy. You could send it to your design team, but they’re buried until next month. So you write up a detailed brief, cross your fingers, and wait two weeks for a first draft that will inevitably require three more rounds of revisions. By the time it’s done, the information is already out of date.
I’ve seen this exact scenario play out in countless marketing and product teams. As the founder of InfoAIGraphic, I’ve spent years talking to teams who are stuck in this content creation bottleneck. They have the expertise and the data, but turning it into compelling visual content that scales is a constant struggle. The manual process is slow, expensive, and frankly, a poor use of your team’s strategic talent.
This is where a new approach comes in. We’re going to break down how to move past the old way of doing things, using an AI timeline generator to not just speed up your workflow, but to fundamentally change how you communicate complex information.
Why Timelines and Roadmaps Are a Secret Weapon for B2B Content
Before we dive into the “how,” let’s talk about the “why.” In B2B, you’re not just selling a product; you’re selling a partnership, a vision, and a result. Timelines, roadmaps, and process flows are incredibly powerful formats for this because they:
- Tell a story over time: They show progress, from project kick-off to launch, or from a customer’s problem to their solution.
- Set clear expectations: A visual roadmap is the fastest way to align stakeholders on what’s happening when.
- Make complex data digestible: Our brains process visuals far faster than text. According to one study, content with relevant images gets 94% more views than content without visuals.
- Build trust and authority: Showing a clear, well-thought-out plan demonstrates competence and builds confidence with prospects and customers.
The demand for this kind of content is only growing. HubSpot research shows that 88% of marketers plan to increase or maintain their investment in infographics in 2024. The problem is that traditional production methods can’t keep up with this demand.
The Old Way vs. The New: What Is an AI Timeline Generator?
For years, creating a timeline or roadmap involved a painful, multi-step process:
- Data gathering: Manually collecting dates, milestones, and descriptions from various sources.
- Designer briefing: Writing a detailed document trying to translate your data into a visual concept.
- Manual design: A designer painstakingly creates each element, line, and text box in a tool like Illustrator or Figma.
- Revision cycles: Back-and-forth emails to fix typos, adjust dates, or change icons.
- Final asset: You get a static PNG or PDF that is difficult to update when a milestone inevitably shifts.
This entire process can take days or even weeks. One analysis found that a professional copywriter can take 4-5 hours just to write a blog post, with another 1-2 hours for uploading—and that’s before creating any custom graphics.
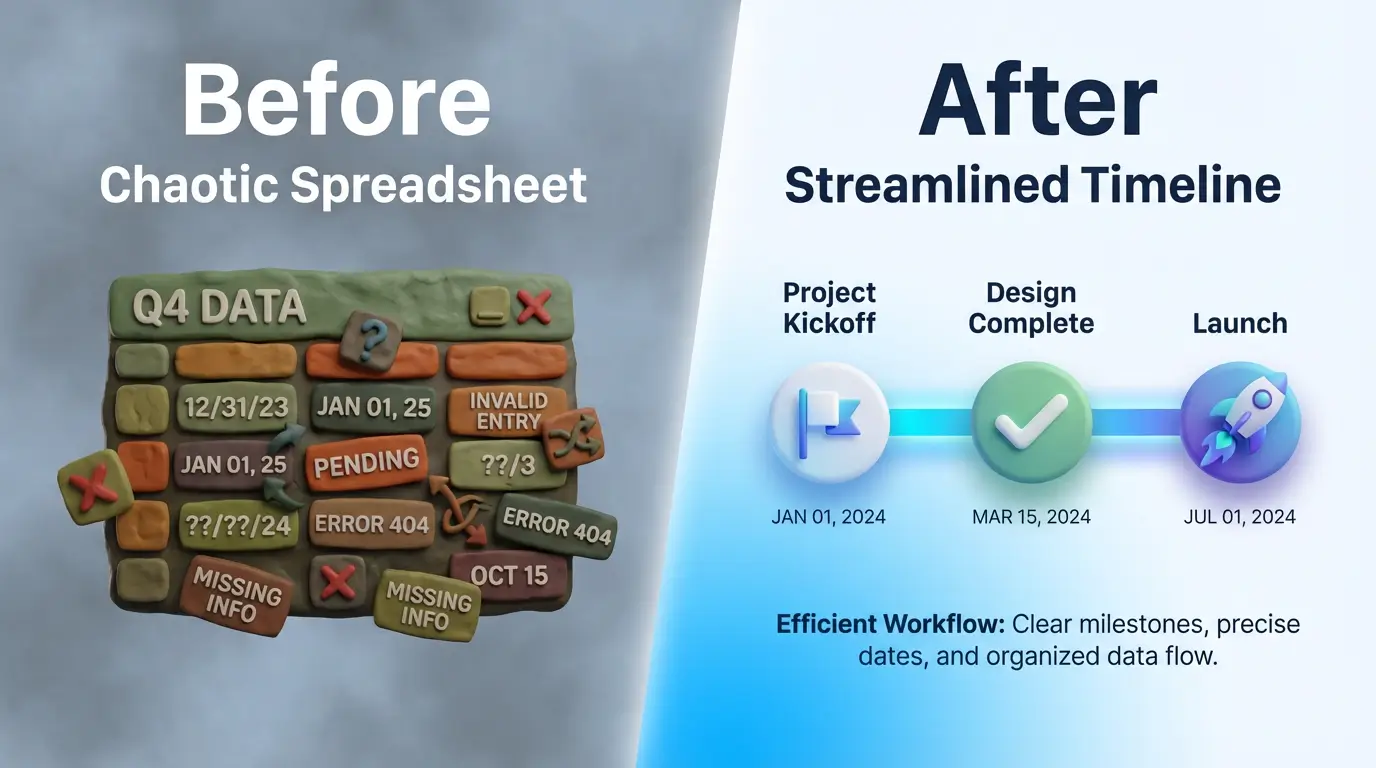
An AI timeline generator shortens this cycle from days to minutes.
It’s not about replacing designers with robots. It’s about automating the most tedious part of the process: translating structured text into a structured visual. You provide the raw information—the dates, the events, the steps—and the AI handles the initial layout, spacing, and visual hierarchy. Your team then spends their time on high-value tasks: refining the narrative, applying your brand, and ensuring the story is perfect.
Beyond Timelines: Using an AI Process Flow Generator for Workflows
The same technology that powers an AI timeline generator is incredibly versatile. Once you start thinking in terms of turning text into structured visuals, a whole new world of content opens up.
This is where tools like an AI process flow generator or AI flowchart from text become essential parts of the marketing toolkit.
Instead of just showing events over time, you can now instantly visualize:
- Onboarding flows: Show a new customer the exact steps from signing up to achieving their first “win” with your product.
- Implementation processes: Give a new client a clear, visual guide to your service delivery process.
- Decision trees: Create an interactive-style flowchart that helps a prospect self-qualify or choose the right product tier.
- Automated comparison charts: Instead of a dense table, generate a visually engaging chart comparing your features against a competitor’s.
I’ve seen teams use this to turn a dry, technical support document into a clear, step-by-step visual guide, dramatically reducing support tickets. Product owners use an AI roadmap maker to generate a new version of their quarterly roadmap for different audiences (engineering, sales, executive) in minutes, not hours.
Step-by-Step Guide: Creating a Project Roadmap with an AI Roadmap Maker
Let’s make this practical. You need to create a visual roadmap for your upcoming Q1 product launch. Here’s the workflow using an AI-powered tool like InfoAIGraphic.

-
Gather Your Raw Data: Don’t worry about formatting. Just list the key information. You can do this in a simple text document, a spreadsheet, or even by copying the text from an existing project plan. Your raw text might look something like this:
- Jan 15: Finalize feature set and technical specs.
- Feb 1: Begin core development sprint (4 weeks).
- Feb 28: Internal alpha testing begins.
- Mar 15: Launch beta to select customers & gather feedback.
- Apr 1: Public launch and marketing campaign kickoff.
-
Choose Your Generator: Open up your text-to-infographic tool. At InfoAIGraphic, we have specific models trained for timelines, roadmaps, and process flows.
-
Input Your Text: Simply copy and paste your raw text directly into the editor. This is the core of the “text to infographic” workflow. The AI is designed to understand the structure of your information, identifying dates, milestones, and descriptions.
-
Generate the First Draft: With a single click, the AI will analyze your text and generate a complete timeline infographic. It will automatically place the events in chronological order, create visual connectors, and establish a clean layout. This is the moment that typically saves you hours of back-and-forth with a designer.
-
Refine and Brand: Now comes the fun part. The AI did the heavy lifting, and you get to be the creative director.
- Apply your brand kit: Change the colors, fonts, and logos to match your brand guidelines with one click.
- Adjust icons: Swap out the default icons for ones that better represent each milestone.
- Tweak the copy: Refine the descriptions for clarity and impact.
-
Export and Share: Export your final roadmap as a high-resolution image (PNG) for presentations and blog posts, or as a vector file (SVG) for infinite scaling. You now have a professional, on-brand visual asset that you created in less time than it takes to drink a cup of coffee.
Ready to try this workflow? Try InfoAIGraphic free and turn your top article into an infographic in under 2 minutes.
Common Mistakes Teams Make (and How to Fix Them)
Adopting AI tools isn’t just about the technology; it’s about refining your process. I see teams run into a few common hurdles when they first start using an AI timeline generator. Here’s how to get ahead of them.
-
Mistake 1: Information Overload.
- The Symptom: Your timeline is cluttered with dozens of tiny milestones, making it impossible to read. You’re trying to cram an entire project plan into one visual.
- The Fix: Be ruthless with your editing. A timeline is for communication, not project management. Focus on the 5-7 most critical milestones that tell the story. For a deeper dive on this, our guide on The B2B Playbook: How to Explain Data with Infographics (and Stop Boring Your Audience) can help you focus on the narrative.
-
Mistake 2: Ignoring Brand Consistency.
- The Symptom: The AI-generated infographic looks great, but it doesn’t look like your company made it. The colors are off, and the font is wrong.
- The Fix: Use a tool that supports brand kits. Before you generate anything, spend 5 minutes setting up your brand colors, logos, and fonts. This ensures that every single infographic you create—whether it’s a timeline, flowchart, or comparison chart—is instantly recognizable and reinforces your brand identity. Adhering to visual standards is one of the key non-negotiable infographic design best practices for B2B teams.
-
Mistake 3: Treating It as a One-Off Task.
- The Symptom: You use the tool to make one great roadmap, but then you go right back to the old, slow process for the next project. You haven’t created a system.
- The Fix: Build a repeatable playbook. Document the simple step-by-step process you just learned. Create a template for how you gather timeline data. The goal is to make AI-assisted infographic creation a standard part of your content repurposing efforts, not a novelty. If you’re building a content machine, this is a core part of a B2B playbook for scaling content.
Generate your first AI infographic from a blog post with InfoAIGraphic — no design skills required.
How an AI Timeline Generator Scales Your Content Strategy
The true power of an AI timeline generator isn’t just about saving time on a single asset. It’s about how it unlocks scale for your entire content marketing strategy. The B2B landscape has only gotten more competitive, with 71% of B2B marketers stating that content marketing has grown more important in the last year.
Here’s how this new workflow helps you win:
- Radical Repurposing: You can now turn every blog post, case study, or whitepaper into a supplemental visual asset. Finished a post on “The History of Your Industry”? Generate a timeline in minutes. Wrote a “How-To” guide? Turn it into a process flow diagram.
- Increased Content Velocity: When you can create visuals 10x faster, you can publish more, test more, and learn more. With AI, some marketers are already saving an average of 3 hours per piece of content they create. This speed allows you to respond to market trends and sales requests in near real-time.
- Hyper-Personalization: Need a roadmap that only shows the milestones relevant to the sales team? Or a version for an executive who only cares about the top three dates? You can now generate these variations in minutes, tailoring your content to your audience without creating a mountain of work for your design team.
This is about moving from a world where visual content is a precious, time-consuming resource to one where it’s an abundant, integral part of your daily communication. If you run into issues, remember that even AI workflows can have hiccups, and having a framework for troubleshooting your infographic workflow is key.
FAQ
Q: How long does it take to create an infographic with an AI timeline generator?
A: For a user familiar with the tool, generating the first draft from prepared text can take less than a minute. Customizing the branding, icons, and copy might take another 5-15 minutes, depending on the complexity. This reduces a multi-day process to under 20 minutes.
Q: Can I use my brand’s colors and fonts?
A: Absolutely. Any professional-grade AI infographic tool should have a “Brand Kit” feature. You can pre-load your brand’s specific color palettes, upload your fonts, and set your logo to ensure every visual you create is perfectly on-brand.
Q: Is an AI timeline generator just for project plans?
A: Not at all! While they are excellent for project roadmaps, you can also use them for company history timelines, visualizing a customer journey, showing the evolution of a product, or outlining the steps in a historical event for a blog post.
Q: Can an AI flowchart from text handle complex processes?
A: Yes, within limits. These tools are fantastic for visualizing standard business processes, decision trees, or user flows with up to 10-15 steps. For extremely complex, system-level architecture diagrams, a specialized technical tool might still be better, but for marketing and communication purposes, AI can handle the vast majority of needs.
From Bottleneck to Flywheel
For too long, visual content has been a bottleneck for ambitious B2B marketing teams. The ideas are there, but the resources aren’t. An AI timeline generator, along with its sibling tools for flows and roadmaps, breaks that bottleneck.
It transforms visual content creation from a slow, manual service into an automated, scalable system. This allows your team to spend less time managing tedious production cycles and more time thinking strategically about the stories you want to tell.
When you can turn any piece of text into a compelling visual in minutes, you don’t just make a single infographic. You build a content engine. You start creating more valuable, engaging, and effective content at a scale you previously thought impossible.
If you’re ready to stop waiting on designers and start scaling your visual content, this is the way to begin. Give the workflow a try and see what you can create.
Share this article

Mateoo
Founder of InfoAIgraphic
Building the fastest way to turn text into viral infographics. Helping creators and businesses scale their visual content without design skills.
Related Articles

Text to infographic ai: Scale B2B Content Faster Now
Use text to infographic ai workflows to convert long-form assets into polished visuals in minutes, improving repurposing speed, reach, and ROI. Read more!
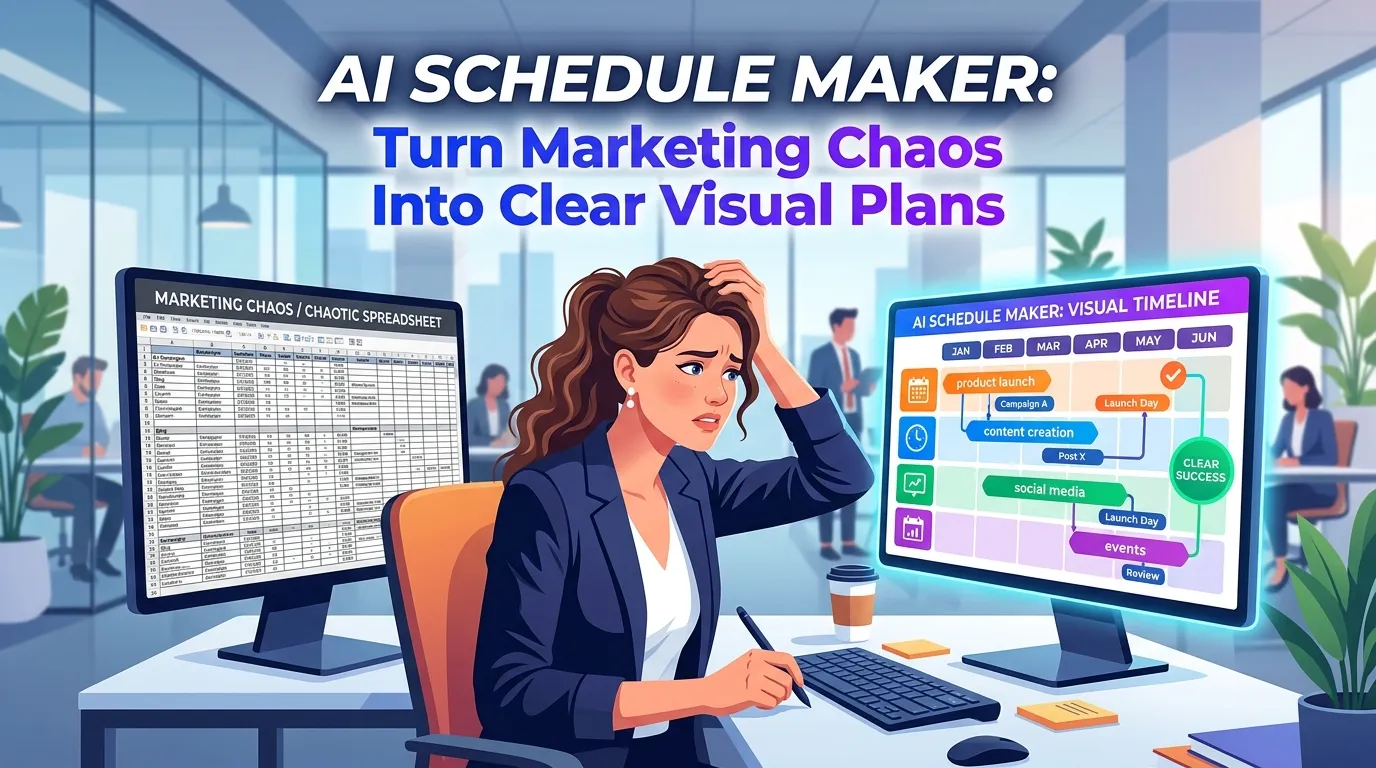
AI Schedule Maker: Turn Marketing Chaos Into Clear Visual Plans
Struggling with messy marketing timelines? Discover how an AI schedule maker turns chaotic plans into clear visual workflows. Step-by-step guide inside.

Why Your Current SEO Report Template Is Failing (And How Visual Reporting Fixes It)
Stop sending boring spreadsheets. Discover the ultimate SEO report template strategy to scale your visual content and build automated visual SEO reporting