Best ai infographic generator: Compare Top Picks 2026
Evaluate the Best ai infographic generator options with clear criteria, real use cases, and a faster path to publish conversion-focused visuals. Discover how!

Best AI Infographic Generator Guide: How to Scale Your Visual Content
I have a folder on my laptop called “The Graveyard.”
It’s full of Google Docs expertly written, well-researched blog posts that I never published. Why? Because they were walls of text. I knew that without strong visuals to break up the concepts, they would bounce readers faster than a slow-loading landing page.
But the alternative was worse. I didn’t have the budget to hire a professional designer for every single article, and I certainly didn’t have three hours to drag-and-drop rectangles in a DIY design tool until my eyes glazed over.
If you lead a content team, you probably know this pain intimately. You have the data. You have the story. But turning that text into a compelling visual asset is a bottleneck that kills momentum.
This is exactly why the search for the best AI infographic generator has exploded. We are moving past the era of “templates” and into the era of “generation” where AI acts as your junior designer, handling the heavy lifting so you can focus on the strategy.
In this guide, I’ll walk you through the current landscape of AI infographic tools, help you choose the right one for your specific needs, and show you a workflow to turn a blog post into a shareable visual in minutes.
The Content-Design Gap: Why You Need AI Now
The pressure to produce visual content isn’t just a feeling; it’s a measurable shift in how B2B buyers consume information.
We know that visuals work. According to Venngage’s visual content marketing statistics, visuals are 43% more persuasive than text alone. Yet, the same report highlights that over 40% of marketers struggle to produce consistent, high-quality visual content.
Why the disconnect?
In my experience building InfoAIGraphic, I’ve seen that the problem usually boils down to three “expensive” hurdles:
- The Time Cost: A single high-quality infographic can take a designer 5–10 hours to conceptualize and execute.
- The Dollar Cost: Outsourcing to an agency easily runs $500–$2,000 per asset.
- The “Translation” Cost: This is the silent killer. You (the expert) have to explain the data to a designer (the creative), and meaningful nuance often gets lost in the back-and-forth.
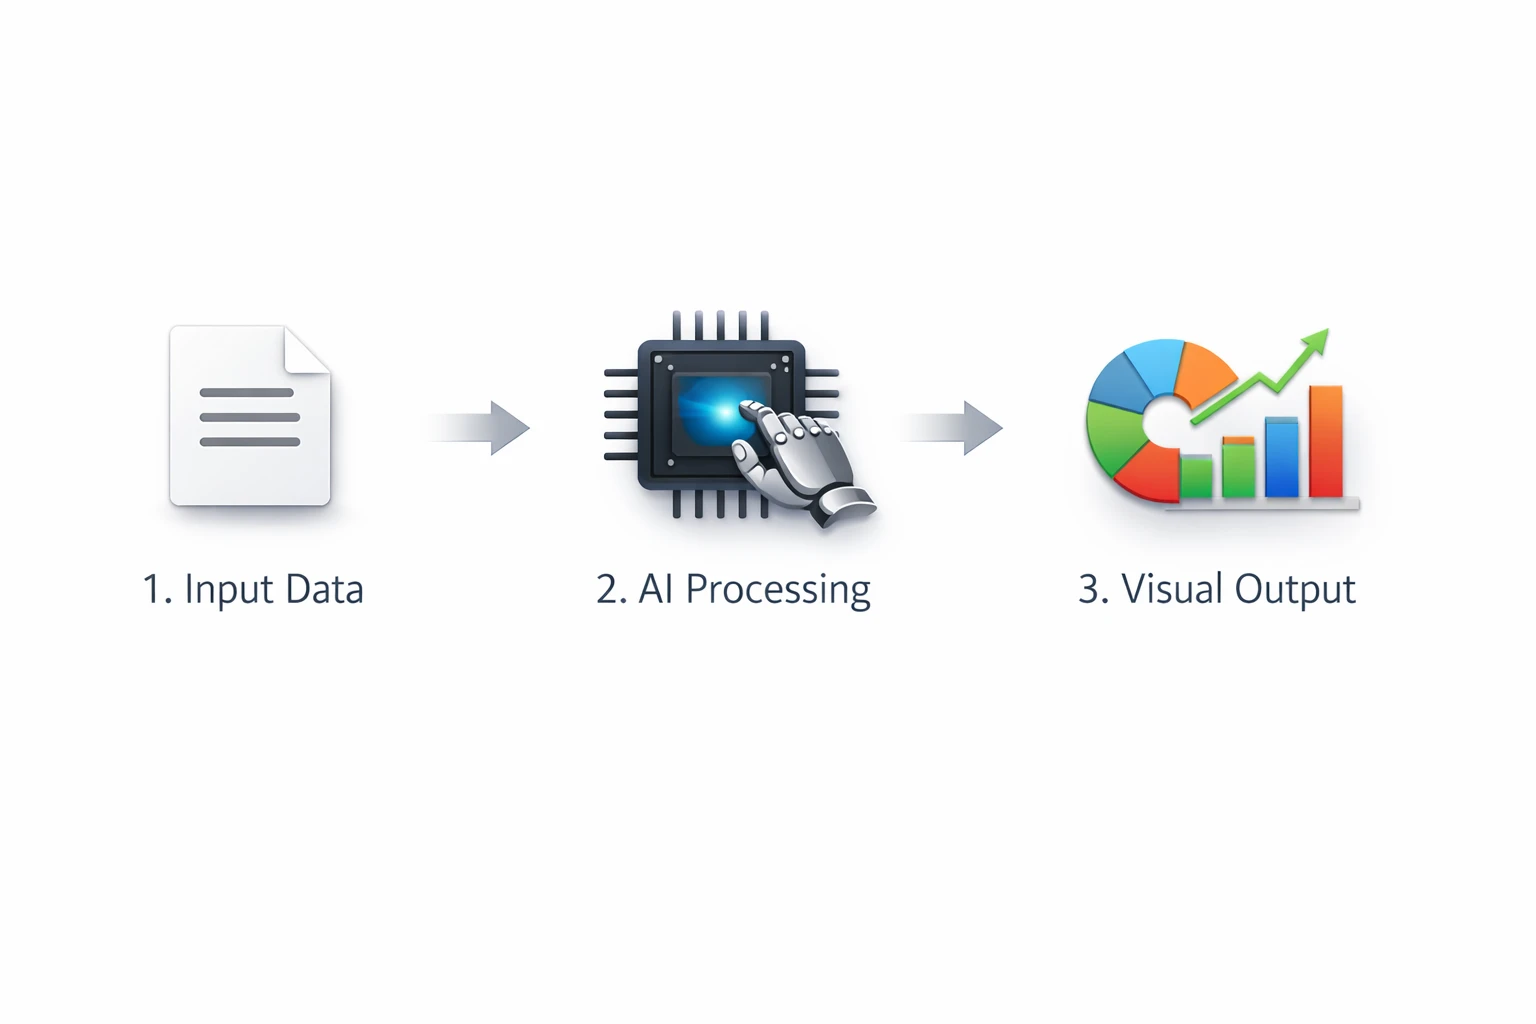
AI bridges this gap. The best AI infographic generators don’t just offer you a faster mouse; they offer a faster brain. They understand the structure of your content and propose a visual hierarchy instantly, allowing you to bypass the blank canvas paralysis.
What Defines the “Best” AI Infographic Generator?
Not all “AI” features are created equal. When evaluating tools, I often see marketers get distracted by flashy features (like “generate a picture of a cat in space”) that aren’t actually useful for B2B communication.
To find the best tool for your stack, look for these four core capabilities:
1. Context-Aware Text-to-Structure
Can the tool read your blog post or data set and understand what matters? A generic image generator (like Midjourney) creates art, but it doesn’t create information. The best tools for infographics understand headlines, bullet points, and data hierarchy.
2. Intelligent Layout Adaptation
If you add three more bullet points, does the design break? Old-school template tools force you to manually resize every box. A true AI generator should automatically adjust the layout to fit your content.
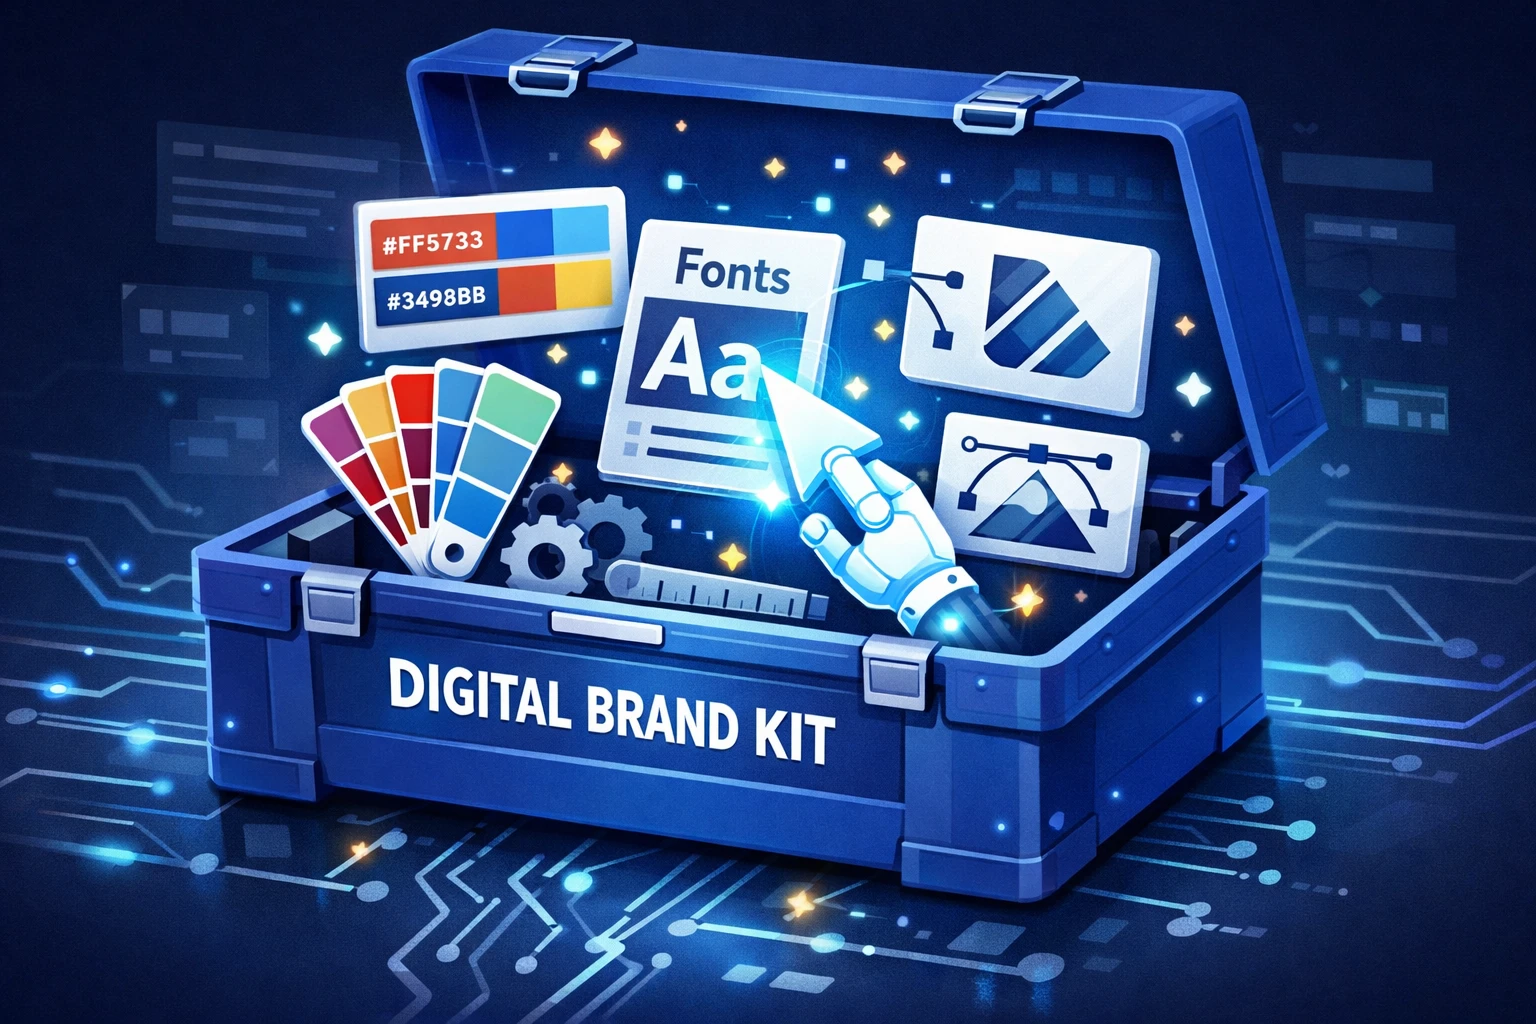
3. Brand Consistency
According to HubSpot’s 2024 State of Marketing, brand consistency is a top priority for growing teams. The tool you choose must allow you to lock in your hex codes and fonts so you don’t look like a generic template factory.
4. Editability
AI gets you 80% of the way there, but you need the final 20%. If a tool generates a static image (JPEG) that you can’t edit text on, it’s useless for marketing. You need a vector-based output where text remains editable.
Top Contenders: Breaking Down the Landscape
Having tested dozens of tools (and building one myself), I categorize the “best” options based on the specific problem they solve. There is no single winner for everyone - it depends on your workflow.
For General Social Media & Design: Canva
Canva is the behemoth we all know. Their “Magic Design” features are impressive for quick social media posts or slide decks.
- Pros: Massive library of assets; very intuitive for non-designers.
- Cons: It is still fundamentally a manual design tool. You are dragging and dropping. For complex data or long-form infographics, it can feel like trying to build a spreadsheet in Microsoft Paint.
- Best for: One-off social graphics and slide decks.
For Data-Heavy Reports: Piktochart / Venngage
These platforms have been around for years and specialize in “boring” B2B data (charts, maps, heavy reports).
- Pros: Excellent integration with spreadsheets; great for visualizing complex numbers.
- Cons: Steeper learning curve. You often still need to start with a template and manually swap out every text box, which is time-consuming.
- Best for: Annual reports and heavy data visualization.
For Content Repurposing: InfoAIGraphic
This is where we focus. If your goal is to take an existing article and turn it into a visual narrative without touching a design tool, this is the specific gap we fill.
- Pros: “Text-to-infographic” focus; turns lists and processes into visuals automatically; speed.
- Cons: Less freedom to “paint” freely compared to Canva (by design, to keep you on-brand).
- Best for: Marketers who need to scale infographic production from blog content.
Ready to try this workflow? Try InfoAIGraphic free and turn your top article into an infographic in under 2 minutes.
Benefits of Using an AI Infographic Generator
Why make this switch? Beyond just “saving time,” there are strategic advantages to using AI for this specific format.
1. Reviving Your Content Archive
You likely have hundreds of blog posts sitting in your archive. Content Marketing Institute’s 2025 research indicates that updating and repurposing existing content is one of the highest ROI activities for B2B teams. With an AI generator, you can systematically go through your top 50 posts, generate a summary infographic for each, and re-promote them on LinkedIn.
2. Improving On-Page SEO
Google images are a massive, underutilized search engine. Unique, branded infographics give you a chance to rank in Image Search. Furthermore, keeping users on your page longer (dwell time) is a positive ranking signal. I’ve found that embedding a text-to-infographic AI visual near the top of a post can increase time-on-page significantly because it gives skimmers a reason to stop scrolling.
3. scalable A/B Testing
In the past, you couldn’t A/B test visuals because they were too expensive to make. Now, you can generate three different versions of an infographic (different colors, different layouts) in minutes and see which one drives more engagement on social media.
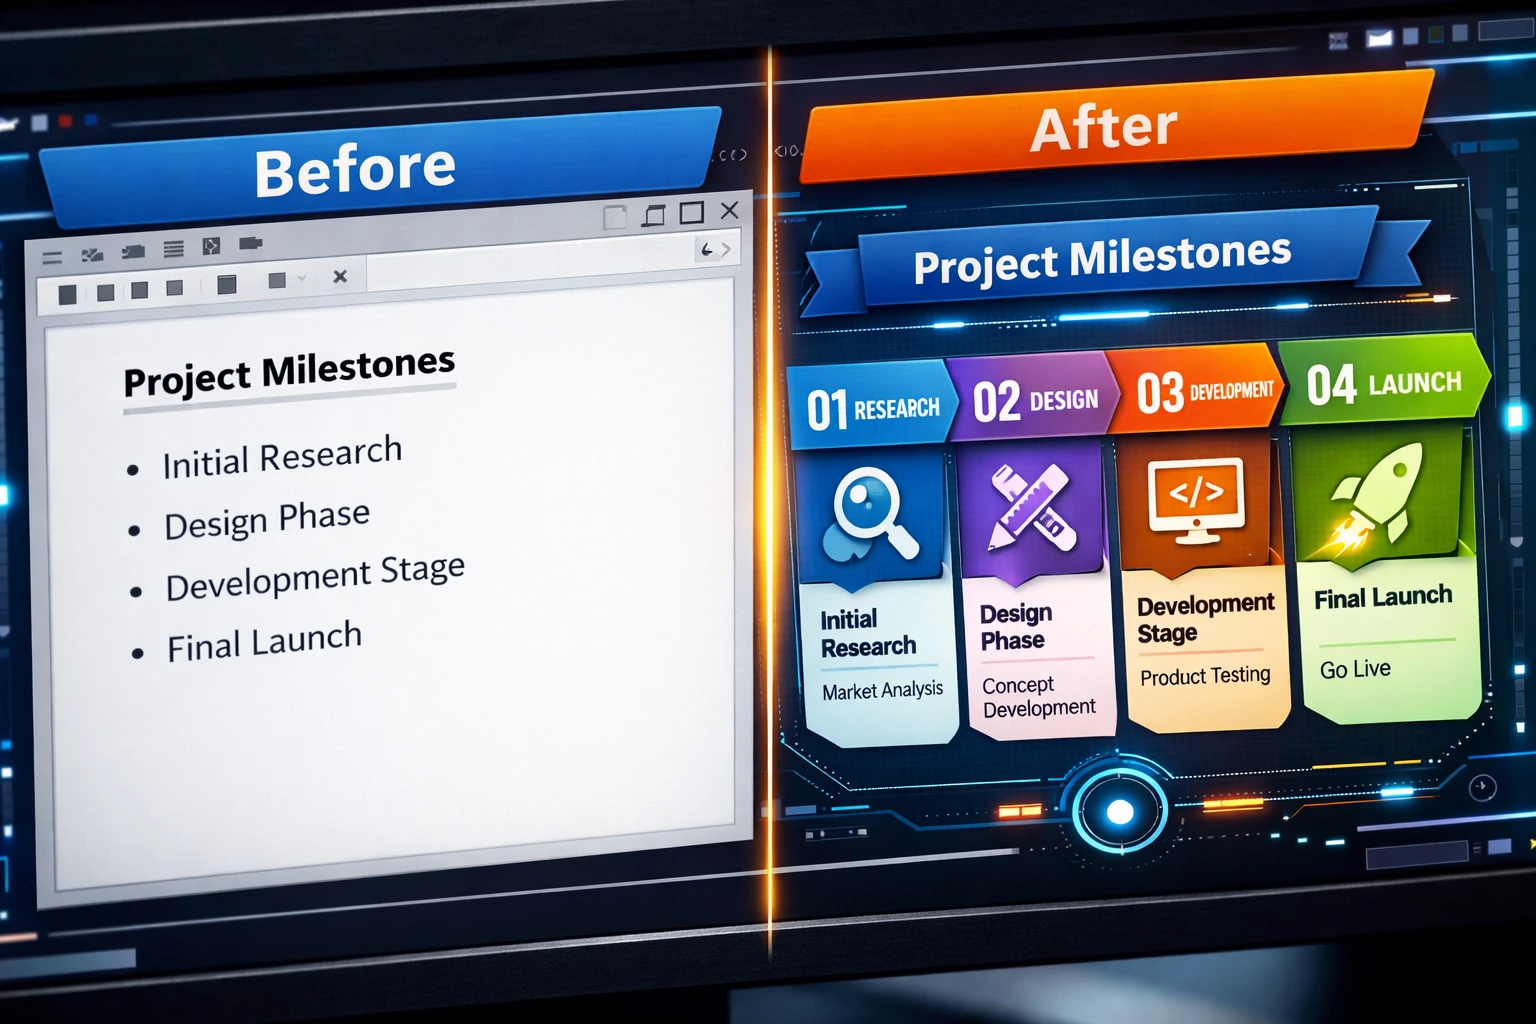
Step-by-Step: Converting a Blog Post into an Infographic
Let’s get practical. Here is the exact workflow I use to turn a 1,500-word article into a concise, shareable infographic using AI tools.
Step 1: Isolate the “Visual Skeleton”
Don’t paste your entire article into an AI tool. It will get confused. Instead, skim your article and find the structure.
- Is it a list? (7 Ways to…)
- Is it a process? (How to X in 5 Steps…)
- Is it a comparison? (X vs. Y…)
Copy just the headers and 1-2 summary sentences for each point. This is your “skeleton.”
Step 2: Choose the Right Layout Logic
If you are using a tool like InfoAIGraphic, you can select the type of narrative.
- For a history or evolution post, use a timeline layout. (See our guide on AI timeline generators for deep dives on this).
- For a “how-to,” use a step-by-step process layout.
Step 3: Input and Generate
Paste your skeleton text into the generator. Pro Tip: Be descriptive with your headers. Instead of just “Step 1,” write “Step 1: Audit Your Content.” This gives the AI more context to suggest relevant icons or imagery.
Step 4: Refine the “Data Density”
Once the AI generates the draft, look at the density. Is it too crowded? A common mistake is trying to cram 500 words into a graphic.
- Cut ruthlessly. An infographic is a teaser, not a white paper.
- Check the flow. Does the eye move naturally from top to bottom?
Step 5: Export and Embed
Export in a high-resolution format (PNG or PDF).
- For SEO: Rename the file from
infographic_final_v3.pngtobest-ai-infographic-generator-workflow.png. - For Social: creating a carousel (PDF) often performs better on LinkedIn than a single tall image.
Generate your first AI infographic from a blog post with InfoAIGraphic - no design skills required.
Common Mistakes to Avoid
Even the best ai infographic generator can’t fix a bad strategy. Here are the pitfalls I see most often:
- The “Kitchen Sink” Syndrome: Trying to include every single point from the article. The result is a cluttered mess that nobody reads.
- Ignoring Brand Guidelines: Using the default AI color palette instead of your brand’s specific hex codes. This dilutes your brand authority.
- Unverified Data: AI can sometimes “hallucinate” or mismatch data points. Always double-check that the chart numbers actually match your source data, especially in industries like healthcare where accuracy is non-negotiable.
FAQ
Q: Can AI-generated infographics rank in Google? A: Yes, absolutely. Google indexes the image file itself (via alt text and filename) and values the engagement signals the image provides. However, the AI tool produces the image; you are responsible for optimizing the file name and alt text for SEO.
Q: How long does it take to create an infographic with an AI generator? A: With a specialized tool, the generation process takes less than 2 minutes. Including time for you to review, tweak text, and export, a realistic workflow is about 10–15 minutes per asset, compared to 5+ hours for manual design.
Q: Is there a free AI infographic generator? A: Many tools offer a “freemium” model. You can usually generate a few designs for free to test the capability, but high-resolution downloads or brand kit features often require a subscription. This is standard across the industry to cover the heavy server costs of AI processing.
Q: Can I edit the text after the AI generates the infographic? A: You should only use tools that allow this. Some basic image generators (like DALL-E) create pixel-based images where text cannot be edited. A true infographic generator creates a layout with editable text fields, allowing you to fix typos or update data later.
Conclusion: Start Small, Scale Fast
The search for the best AI infographic generator isn’t about finding a tool that replaces human creativity - it’s about finding a tool that removes the friction from your workflow.
We are in a golden age for content teams. You no longer have to choose between “fast,” “cheap,” and “good.” With the right AI integration, you can turn your blog’s “graveyard” of text into a vibrant library of visual assets that drive real engagement.
My advice? Start with one post. Take your best-performing article from last month, strip it down to its headers, and run it through an AI generator today. The results might just surprise you.
Share this article

Mateoo
Founder of InfoAIgraphic
Building the fastest way to turn text into viral infographics. Helping creators and businesses scale their visual content without design skills.
Related Articles

Finding the Best Alternatives to Infography.in for Scalable Visual Content
Discover the best alternatives to infography.in. Compare top AI workflow tools, learn how to scale your visual content, and speed up infographic creation.

Free ai infographic generator: Top Tools for Marketers
Choose a free ai infographic generator that fits your workflow, then create branded visuals faster to boost organic reach, engagement, and shares. Discover how!

Top 5 AI Graph Maker Tools for 2026: Charts, Reports, Infographics
Compare AI graph maker tools for turning data, text, and reports into charts or infographics. See best use cases, limits, and exports.