Mental health infographic: Design for Clarity and Impact
Create a mental health infographic that communicates sensitive topics clearly, builds trust, and increases shares without overwhelming your audience. Read more!

Mental Health Infographic Guide: How to Visualize Invisible Struggles
I’ve seen a pattern lately that frustrates me, and if you work in healthcare marketing or corporate communications, you’ve probably felt it too.
You have a critical message to share about mental well-being—perhaps it’s data on burnout, a guide to anxiety coping mechanisms, or stats on workplace wellness. You write a well-researched, compassionate article. But when it comes time to visualize it, you hit a wall.
You open a stock photo site, type in “mental health,” and you get… a person in a grey hoodie clutching their head in a dark room.
It’s clichéd. It’s isolating. And frankly, it’s bad marketing.
Mental health is nuanced, invisible, and complex. It doesn’t look like a stock photo. This is where the mental health infographic becomes your most powerful asset. It allows you to visualize the invisible—turning abstract feelings and dense medical data into accessible, empathetic resources that people actually want to share.
In this guide, I’m going to walk you through exactly how to build mental health infographics that resonate. We’ll look at why they work, the specific design rules you must follow to avoid doing harm, and how to use AI tools to generate them without needing a degree in graphic design.
The Problem: Why Text Often Fails Mental Health Topics
When we communicate about mental health, we are usually fighting two battles: stigma and complexity.
Text alone struggles to win these battles. A 2,000-word white paper on “The Neurobiology of PTSD” is valuable, but it is not accessible to a patient in crisis or a busy HR manager looking for quick stats.
According to the Social Science Research Network, 65% of the population are visual learners. When you lock critical health information behind walls of text, you are effectively excluding the majority of your audience from understanding it.
I see teams waste thousands of dollars on content that nobody reads because the cognitive load is too high. A mental health infographic bridges that gap by:
- Simplifying the complex: Breaking down disorders or treatments into step-by-step visuals.
- Creating emotional distance: Sometimes, reading a personal story is too raw. Data visualization allows people to process the information objectively before engaging emotionally.
- Increasing retention: We process visuals 60,000 times faster than text.
What is a Mental Health Infographic?
A mental health infographic is a visual representation of data, knowledge, or guidance related to psychological well-being. Unlike a standard business chart, it requires a unique blend of accuracy (because it’s health info) and empathy (because it’s human).
Common types I see working well for B2B and healthcare content strategies include:
- Prevalence Data: Maps or charts showing how common a condition is (reducing isolation).
- Symptom Checklists: Visual icons representing behaviors or feelings.
- Coping Mechanisms: Flowcharts for breathing exercises or grounding techniques.
- Resource Navigation: Decision trees on how to find a therapist or access EAP benefits.
If you are just getting started with visual content, you might want to read my breakdown on AI infographic design for beginners to understand the basics of layout and flow.
3 Core Principles for Mental Health Visuals
Before you open any design tool, you need to understand the “safety rules” of this niche. Designing for mental health is not the same as designing for SaaS revenue growth.
1. Color Psychology Matters More Than Brand Guidelines
In my own tests, I’ve found that adhering too strictly to corporate brand colors can backfire in mental health content. If your brand colors are “urgent red” or “electric yellow,” they might induce anxiety rather than calm.
- Do: Use cool tones (blues, greens, soft purples) which are associated with trust and stability.
- Don’t: Use jarring, high-contrast neons for background elements.
According to 99designs’ research on color psychology, blue is overwhelmingly the preferred color for healthcare because it lowers the heart rate and signals reliability.
2. Representation Without Stereotypes
As I mentioned in the intro, avoid the “head-clutcher.” It stigmatizes mental health as purely tragic.
Instead, use metaphorical imagery.
- Instead of a crying person, use a tangled knot untying itself.
- Instead of a dark storm cloud, use a battery recharging.
- Instead of isolation, show connection.
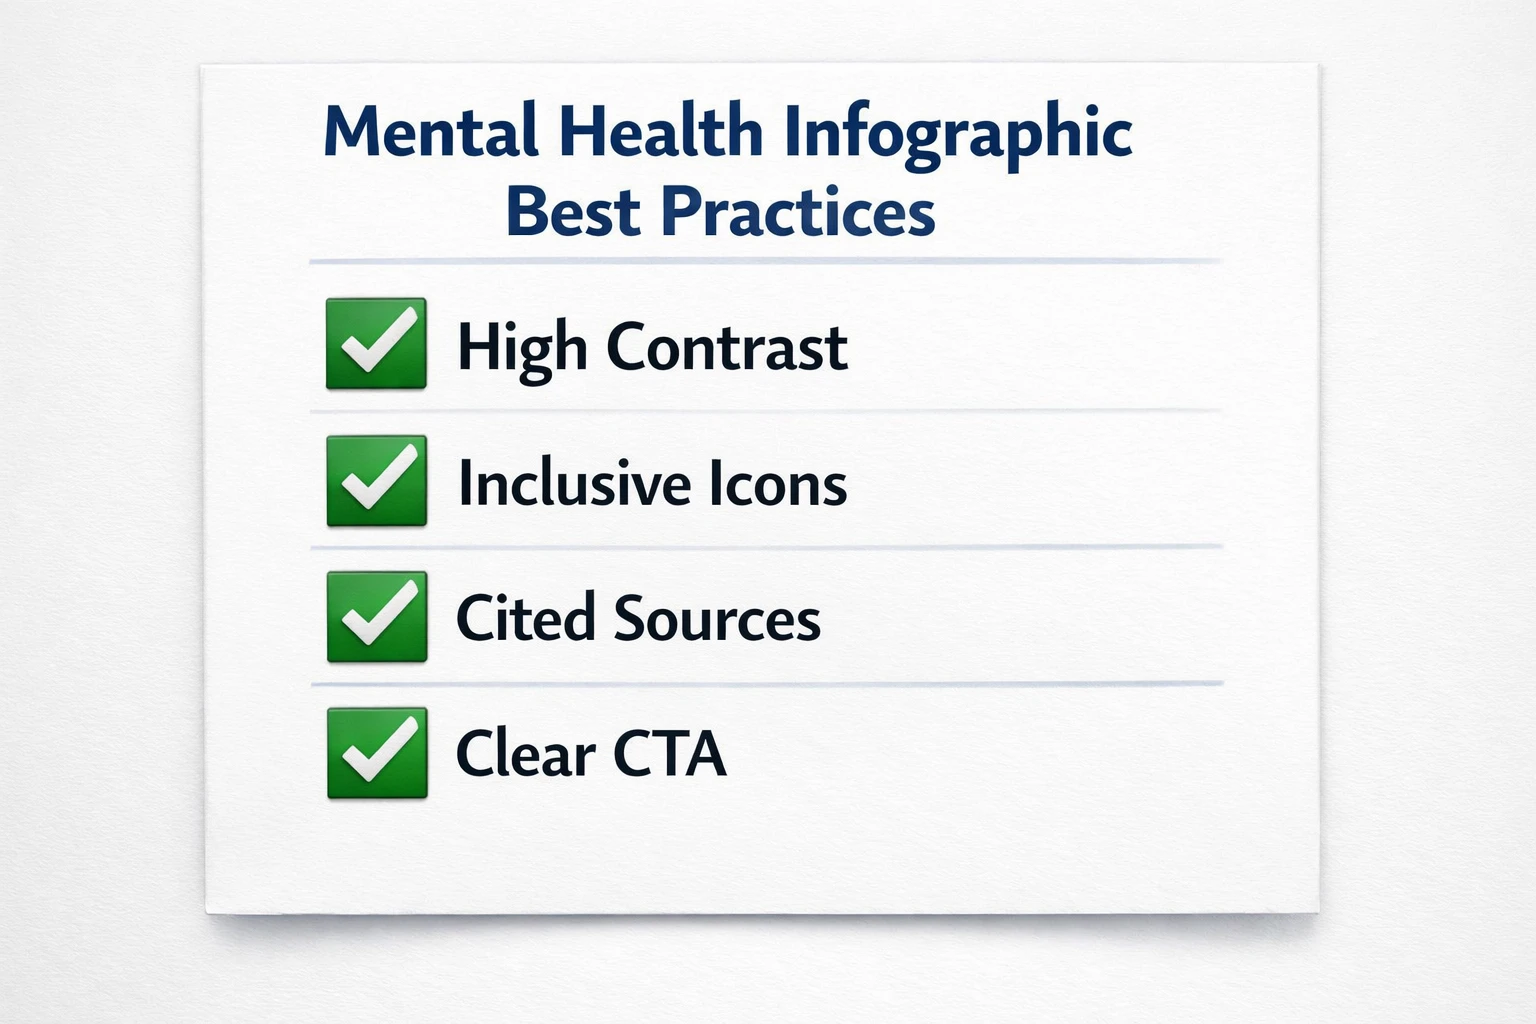
3. Accessibility is Non-Negotiable
You are likely creating content for people who may have cognitive impairments, ADHD, or visual processing differences.
- Contrast: Ensure text stands out clearly against the background (WCAG AA standards).
- Fonts: Use sans-serif fonts that are easy to scan.
- Alt Text: Never publish a mental health infographic without detailed alt text for screen readers.
How to Create a Mental Health Infographic (Step-by-Step)
If you’ve never built one, here is the workflow I use. It balances speed with the sensitivity required for this topic.
Step 1: Vetting Your Source Data
This is the most critical step. You cannot afford to be wrong.
- Use primary sources: CDC, WHO, NIMH, or peer-reviewed journals.
- If you are citing a statistic (e.g., “1 in 5 adults experience mental illness”), link directly to the study in your accompanying text.
- Pro tip: If you are using AI to summarize data, always double-check the numbers against the original PDF. AI hallucinations in healthcare content are a liability.
Step 2: The “Empathy Draft” (Scripting)
Don’t jump into design yet. Write the script.
- Headline: Clear and benefit-driven (e.g., “5 Ways to Support a Grieving Colleague”).
- Tone: Is it clinical? Supportive? Urgent?
- Takeaway: What is the one thing the reader should do after seeing this?
Step 3: Visualization and Layout
Here is where you choose your format.
- The Listicle: Great for “Tips for Better Sleep.”
- The Comparison: Great for “Sadness vs. Depression.”
- The Process: Great for “How to Find a Therapist.”
If you are struggling to visualize complex medical data, check out our guide on AI in healthcare infographics, which specifically covers handling dense medical terminology.
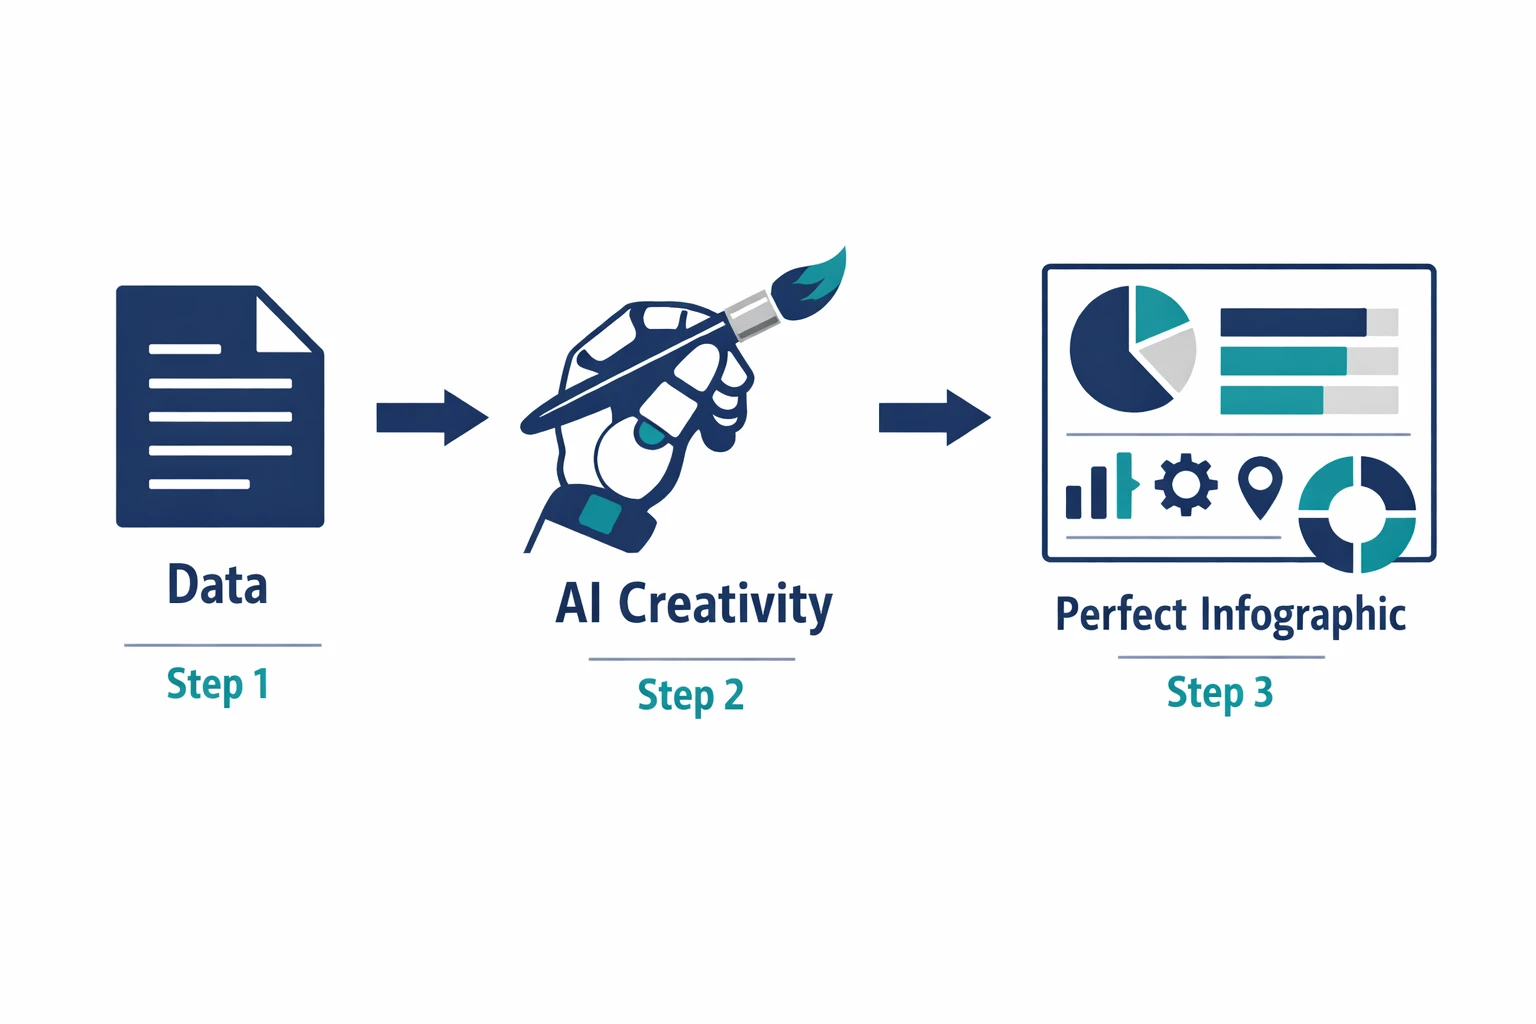
Step 4: Generation (AI vs. Manual)
Years ago, I would send a wireframe to a designer and wait three days. Now, this is where AI shines.
You can feed your vetted script into a tool like InfoAIGraphic. You might use a prompt like:
“Create a calming, minimal infographic about ‘5 Signs of Burnout.’ Use soft blue and sage green colors. Avoid cluttered text. Use simple line icons for symptoms like fatigue and irritability.”
The AI handles the layout and spacing, which is usually the hardest part for non-designers.
Step 5: The “Do No Harm” Review
Before publishing, ask:
- Does this visual inadvertently shame the reader?
- Is the data clear, or is the chart misleading?
- Is the call to action (CTA) clear? (e.g., “Call 988 for immediate help”).
Ready to try this workflow? Try InfoAIGraphic free and turn your mental health educational content into a professional infographic in under 2 minutes.
Common Mistakes to Avoid
Even experienced teams get this wrong. Here are the pitfalls I see most often in the wild.
Overcrowding the Canvas
When you care about a topic, you want to include everything. But a mental health infographic that is too busy can actually trigger anxiety in the viewer—the exact opposite of your goal.
- Fix: Cut your text by 50%. Use white space as a design element.
Ignoring “Trigger Warnings” or Content Notes
If your infographic covers sensitive topics like trauma or self-harm, you need to prepare the viewer.
- Fix: Include a small note at the top or in the caption: “Content Note: Discusses symptoms of PTSD.”
Forgetting Mobile Readability
According to HubSpot’s marketing trends, over 50% of content is consumed on mobile devices. If your font is size 10, nobody on a smartphone will read it.
- Fix: Use vertical layouts (1080x1920px) rather than horizontal ones for social media.
Why AI is a Game Changer for Health Awareness
I talk to a lot of non-profits and small healthcare practices. They have incredible expertise but zero design budget. They usually rely on Canva templates that look… well, like templates.
AI tools bridge this resource gap. They allow a solo therapist or a small HR team to produce high-quality visual content that looks professional enough to build trust.
However, a word of caution: AI is a tool, not a compliance officer. If you use AI tools for infographic creation, you are still the editor-in-chief. You must ensure the AI hasn’t hallucinated a medical claim.
When to use AI:
- Structuring layouts.
- Generating icon ideas.
- Summarizing long articles into bullet points.
- Color palette generation.
When NOT to use AI:
- To invent statistics.
- To provide medical advice without human review.
Mental Health Infographic Strategies for B2B
You might think mental health is a B2C (business-to-consumer) topic. But in 2026, it is a massive B2B conversation.
Companies are buying wellness platforms, EAP services, and coaching tools. If you are marketing to HR directors or executives, your mental health infographics need to speak the language of ROI and Culture.
- Example 1: “The Cost of Burnout.” Show the financial impact of lost productivity using a bar chart.
- Example 2: “Psychological Safety in Teams.” Use a flow chart to show how safety leads to innovation.
For inspiration on how other teams are doing this, look at our collection of AI infographic examples.
Generate your first AI infographic from your next blog post with InfoAIGraphic — no design skills required.
FAQ: Mental Health Infographics
Q: How do I ensure my mental health infographic is inclusive? A: Use diverse iconography that represents different ages, races, and abilities. Also, ensure your language is “person-first” (e.g., “person with schizophrenia” rather than “schizophrenic”).
Q: Can AI-generated infographics rank in Google? A: Yes, absolutely. Google indexes the image itself, but more importantly, it crawls the text around the image and the alt text. An original infographic can also earn backlinks from other sites, which is a huge SEO signal.
Q: How long does it take to create one with InfoAIGraphic? A: Once you have your text or topic ready, the generation process takes about 1–2 minutes. You’ll spend another 5–10 minutes refining the text or swapping icons, but the “heavy lifting” of design is instant.
Q: What is the best file format for sharing these? A: Use PNG or WEBP for the web (crisp lines, low file size). If you are printing them for a clinic waiting room, you will need a high-resolution PDF.
Q: Is it okay to use humor in mental health infographics? A: It is risky. “Relatable” humor (like memes about anxiety) works for some B2C brands on Instagram, but for B2B or serious healthcare providers, it is safer to stick to empathetic, helpful tones.
Conclusion
We are living in an era where mental health awareness is at an all-time high, yet the clarity of information often lags behind.
As marketers and creators, we have a responsibility to make this information accessible. A well-crafted mental health infographic does more than just look good on a Pinterest board—it validates someone’s experience, simplifies their path to help, and might even save a life by making critical information digestible.
You don’t need a massive design team to do this anymore. You just need empathy, accurate data, and the right tools to bring it to life.
If you have a blog post or a policy document that is gathering dust because it’s too dense to read, try turning it into a visual today.
Share this article

Mateoo
Founder of InfoAIgraphic
Building the fastest way to turn text into viral infographics. Helping creators and businesses scale their visual content without design skills.
Related Articles

AI in healthcare infographic: Simplify Medical Data
Use ai in healthcare infographic workflows to translate complex clinical data into clear visuals your audience understands quickly and trusts. Read more!

YouTube Video Summarizer API Key: The Founders Guide to AI Infographics
Discover how a YouTube video summarizer API key transforms long content into stunning AI infographics. Learn workflows, prompt engineering, and visual data
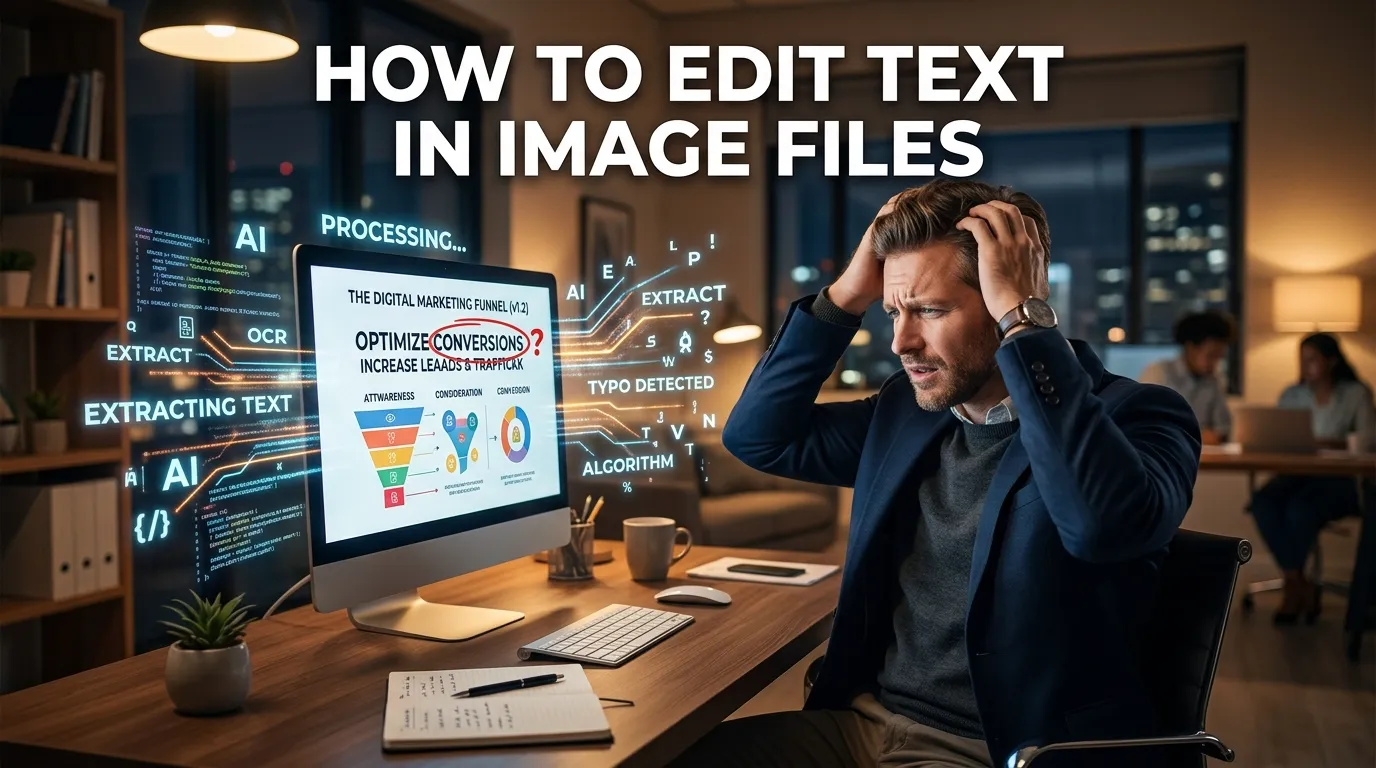
How to Edit Text in Image Files: The Founder’s Guide of Infographic Design 2026
Learn how to edit text in image files using AI. Discover how marketers extract data from static visuals and turn them into dynamic, stunning infographics.