How to Edit Text in Image Files: The Founder’s Guide to Turning Static Pictures into Dynamic Data Visualizations
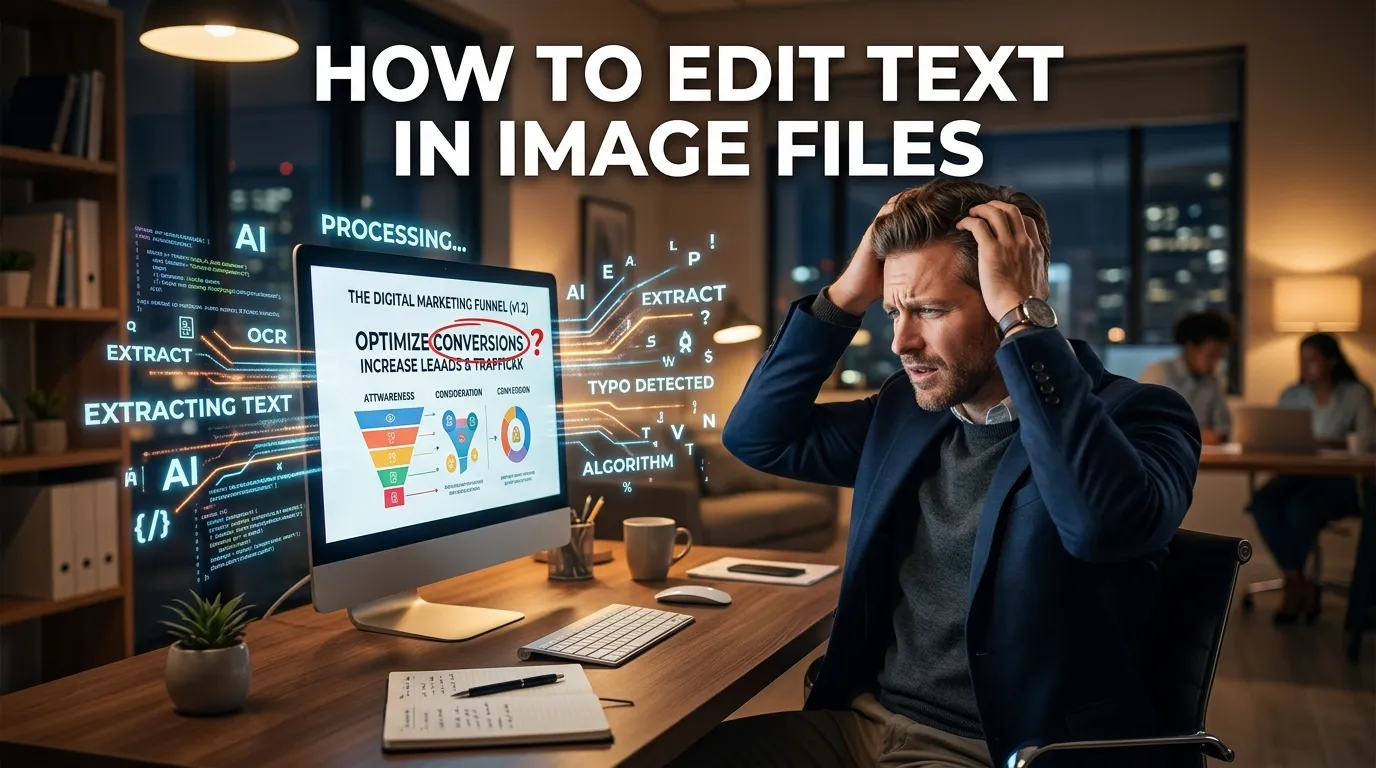
I’ll never forget the email that pushed me to build InfoAIGraphic. It was a Tuesday evening, and a client sent me a flat JPEG of a complex marketing funnel. The message read: “Can we just update the text in the middle three boxes? The numbers changed.”
Anyone who has worked in digital marketing or design knows the sinking feeling that follows that request. You can’t “just update” text in a flattened image. The layers are gone. The font file is missing. The background has a subtle gradient that will look awful if you try to clone-stamp over it.
For years, the standard approach was pure brute force. We would open a photo editor, painstakingly erase the old words, try to match the typography, and patch the background like a digital surgeon. It was slow, expensive, and the results rarely looked professional.
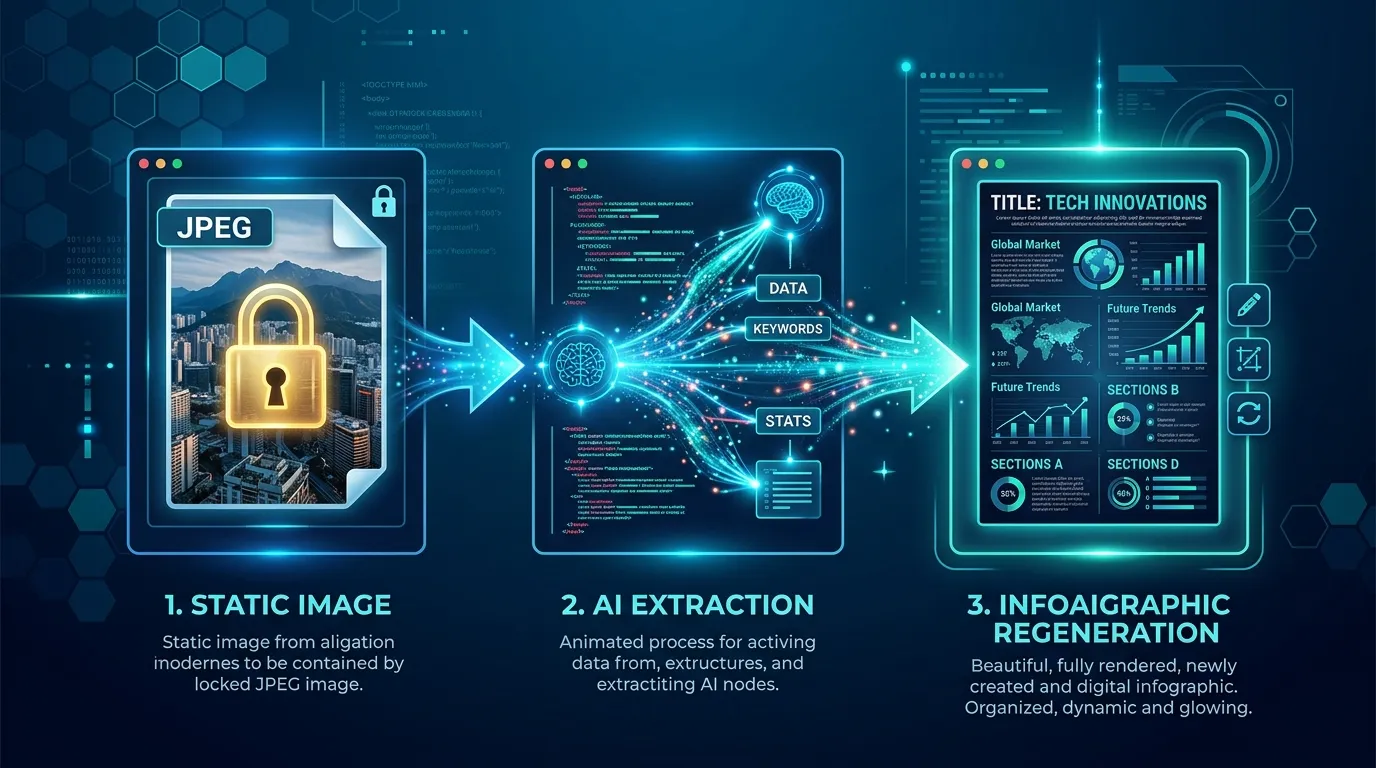
Today, we have a fundamentally better way to solve this problem. We no longer need to patch pixels. Instead, we use artificial intelligence to understand the visual text, extract the core data, and instantly regenerate a brand-new, fully editable infographic.
If you are a marketer, founder, or creator struggling with locked data inside static graphics, this guide is for you. I am going to walk you through exactly how the modern workflow operates, why old-school optical character recognition (OCR) is obsolete, and how you can transform flat pixels into dynamic data stories.
Key Takeaways
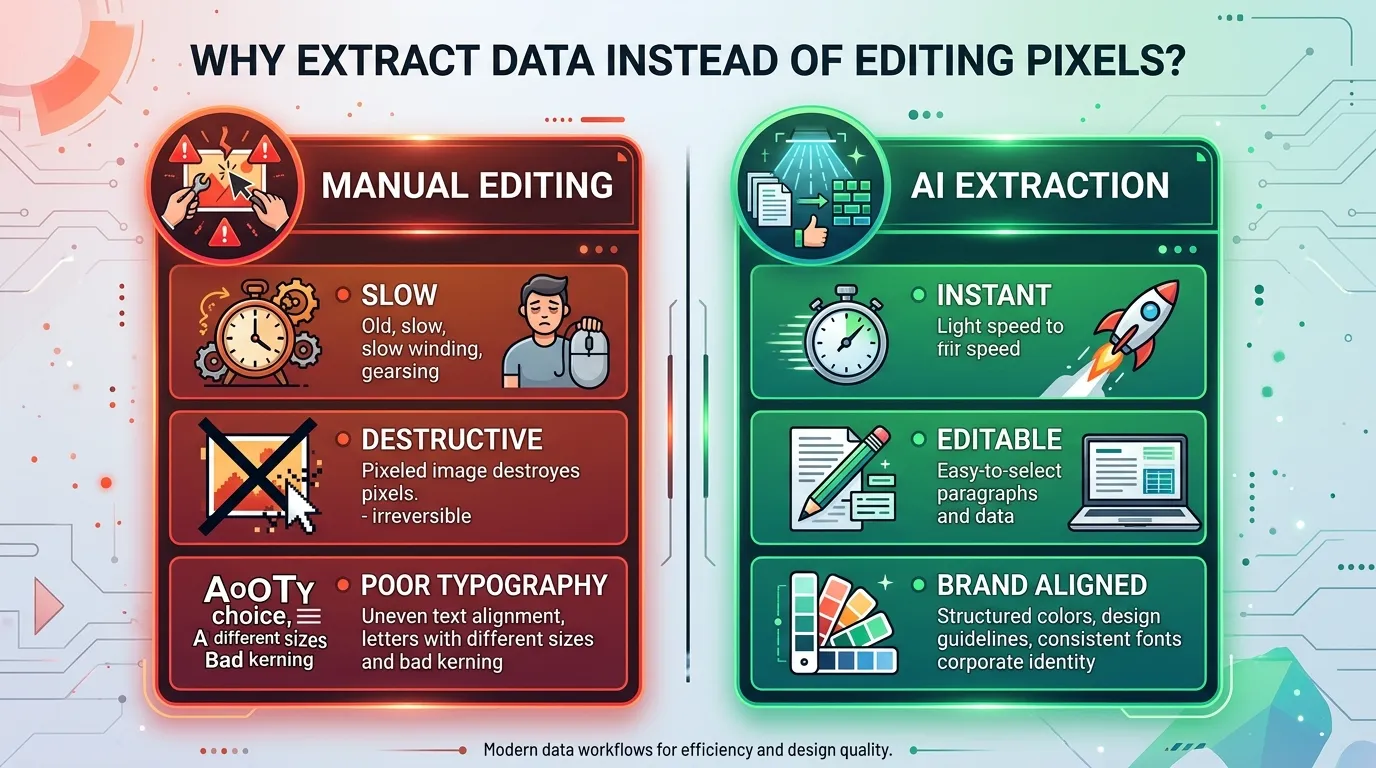
- Stop patching pixels: The most efficient way to edit text in an image is to extract the underlying data using AI and regenerate the visual completely.
- Context matters over character recognition: Modern artificial intelligence image to text tools don’t just read letters; they understand the structural relationship between data points in your visual.
- Regeneration creates flexibility: By moving from a static JPEG to a dynamic data visualization, you gain the ability to instantly update numbers, swap brand colors, and iterate without starting from scratch.
The Core Problem: Why Modifying Visual Text Feels Like a Nightmare
Let’s look closely at why editing text inside an existing picture is so difficult. When a graphic designer exports a project as a PNG or JPEG, all the individual elements—the text, the drop shadows, the background colors, the vector shapes—are compressed into a single, flat grid of pixels.
The text is no longer text. It is just a collection of colored squares that happen to look like letters to the human eye. The computer does not know that the cluster of black pixels says “Q3 Revenue.”
When you try to erase those pixels, you leave a hole in the image. You then have to recreate whatever was behind the text. If the background is a solid, uniform white, you might get away with it. But if the text sits over a photograph, a complex gradient, or an intricate illustration, you are in for a long, frustrating session of cloning and patching.
Even if you successfully erase the old words, you face the typography problem. You need to know the exact font family, weight, tracking, and leading used by the original creator. If you guess wrong, the new text will look pasted on and amateurish.
This is why the traditional method of trying to alter the pixels directly is a trap. It treats the symptom (wrong words) instead of the root cause (a rigid, destructive file format). As marketers, we need agility. We need to be able to pivot our messaging, update our statistics, and test different copy variations without waiting three days for a design agency to return a revised file.
The Evolution from OCR to Generative AI
For a long time, the only automated help we had was optical character recognition. OCR technology has been around for decades. It works by scanning an image, looking for high-contrast shapes that resemble the alphabet, and outputting raw text.
If you ever fed a scanned document into a piece of software in the early 2010s, you know how brittle OCR can be. It would turn a “5” into an “S,” completely ignore columns, and output a messy, unformatted block of words.
Traditional OCR is blind to context. It does not understand that a large, bold word at the top is a headline, or that a series of numbers aligned vertically represents a financial table.
The breakthrough we rely on today is the shift toward “artificial intelligence image to text” processing. We are now using large multimodal models that look at an image the same way a human does.
When modern AI analyzes a visual, it doesn’t just read the characters. It comprehends the layout. It knows that a box pointing to another box indicates a workflow. It understands that a pie chart with labels is communicating percentage shares.
This capability is massive for marketing productivity. According to recent research from McKinsey [1], generative AI has the potential to increase the productivity of the marketing function with a value between 5 and 15 percent of total marketing spending. By eliminating the manual data entry and pixel-pushing associated with updating graphics, we reclaim hours of focused, strategic time.
Why Marketers Need to Rethink Static Images
Why do we care so much about fixing these images anyway? Why not just write out the new information in a plain text post or a bulleted list?
Because visual communication is non-negotiable in modern marketing. Your audience is scrolling rapidly, and you have fractions of a second to capture their attention.
Mailchimp [2] notes that the human brain processes visual information at an astonishing speed, making it an incredibly effective way to capture attention and convey complex messages efficiently. If you strip the visual formatting away from your data, you lose your audience.
Furthermore, Wix [3] points out that visual content has the power to break through the noise and grab the attention of audiences in a way that words alone simply cannot, enhancing engagement and improving brand recall.
This creates a tension. On one hand, we know we must use visual content to succeed. On the other hand, traditional visual content is static, rigid, and hard to update.
The solution is to stop viewing infographics and data visualizations as permanent, finished products. We need to treat them as flexible, code-based assets. When you see an outdated graphic, your goal shouldn’t be to manually edit the text layer. Your goal should be to extract the visual text, update the data payload, and push that new data through an AI generator to render a fresh, flawless graphic.
To make this crystal clear, let’s compare the three different ways you can approach the problem when your boss asks you to update the text in an existing graphic.
| Methodology | The Process | Pros | Cons | Best For |
|---|
| Manual Pixel Patching | Using a photo editor to erase old text, rebuild the background, guess the font, and type new text. | No new software required if you already own design tools. | Extremely slow. Often looks messy. Not scalable for multiple edits. | Fixing a single typo on a solid white background. |
| Traditional OCR + Manual Rebuild | Running the image through a basic text scanner, copying the raw text, and manually building a new design from scratch. | Saves you from having to type out long paragraphs manually. | Loses all formatting, hierarchy, and context. Still requires heavy manual design work. | Extracting a long quote or a dense paragraph of plain text. |
| AI Data Extraction + InfoAIGraphic | Using multimodal AI to extract the text AND its structural relationship, then feeding that structured data into an AI infographic generator. | Incredibly fast. Perfect typography and brand alignment. Creates a permanently editable asset. | Requires learning a new workflow and writing a basic prompt. | Updating tables, flowcharts, marketing funnels, and complex data stories. |
As you can see, the moment you move away from treating the image as a canvas and start treating it as a data container, your entire workflow speeds up.
To truly grasp how transformative this workflow is, we need to look at real-world applications. Here are five scenarios where extracting and regenerating visual text saves marketers and founders from massive headaches.
1. B2B Sales Decks & Vision Boards
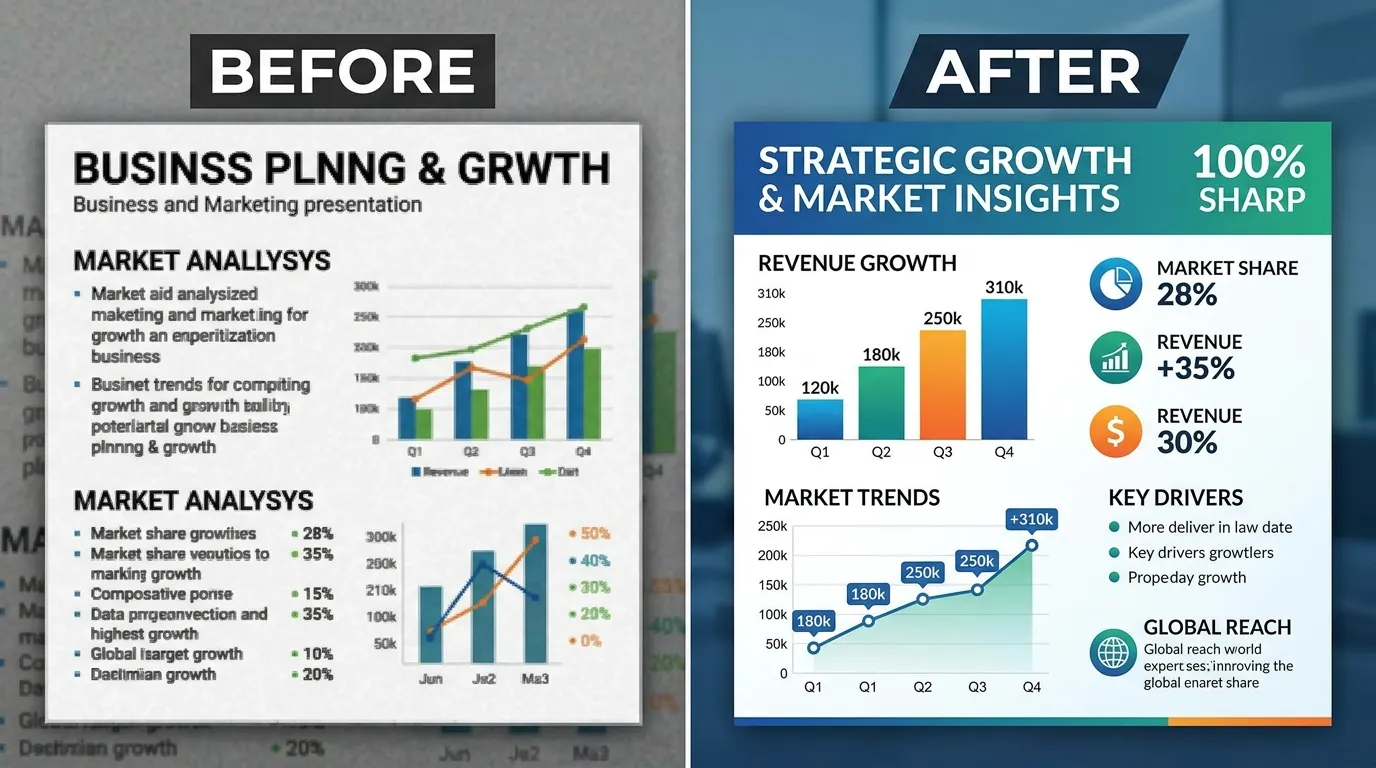
Sales teams are notorious for screenshotting slides from old presentations and pasting them into new decks. Over time, these screenshots become degraded, blurry artifacts. When you need to update the key performance indicators (KPIs) in one of these graphics, you are stuck.
Instead of hunting down the original presentation file from three years ago, you can feed the blurry screenshot into an AI tool. The AI reads the old metrics, you provide the new quarterly numbers, and you generate a fresh, high-resolution slide. For a deeper look at how B2B teams are structuring these assets, I highly recommend checking out our guide on Vision Board Examples: How B2B Teams Visualize Success in 2026.
2. Competitor Pricing Tables
Marketers frequently need to benchmark their pricing against competitors. Often, the only way to get a competitor’s pricing table is to take a screenshot of their website.
If you want to present this data to your leadership team—but you want to change the text to highlight specific feature gaps—you can’t just edit their screenshot. By extracting the text, you turn their pricing image back into structured row-and-column data. You can then edit the text, add your own commentary, and generate a totally new comparison chart that matches your company’s brand colors.
3. Medical Data & Research Posters
Healthcare marketing and medical communications rely heavily on complex diagrams and dense data posters. Often, a researcher will hand a marketer a flat image of a clinical trial result and say, “Can we simplify the text for the patient brochure?”
Editing the text directly on a dense medical chart is nearly impossible without ruining the axes and data lines. The AI extraction method is a lifesaver here. You pull the data points, rewrite the medical jargon into plain English, and generate a new chart. We cover this exact process in detail in our AI in healthcare infographic: Simplify Medical Data post.
4. Financial Reports & Spreadsheets
Have you ever received a screenshot of an Excel spreadsheet pasted into an email? It is one of the most frustrating ways to receive data. If you need to fix a typo in the header row or change a currency symbol, you are completely blocked.
Using multimodal AI, you can upload the image of the spreadsheet and instruct the AI to output it as a markdown table. Once you have the editable markdown, you can fix the text and instantly convert it into a beautiful, easy-to-read infographic for your annual report.
5. Conference Whiteboards
Founders and strategists love whiteboards. At the end of a long meeting, someone inevitably takes a photo of a whiteboard covered in messy, handwritten text, circles, and arrows.
Turning that photograph into a clean graphic used to take a designer hours. Now, artificial intelligence image to text models can read the handwriting, understand the flow of the arrows, and extract the entire concept. You edit the text to make it sound professional, and then generate a crisp flowchart.
Step-by-step guide: How to Edit Text in Image Files by Reimagining Them as Dynamic Infographics
Are you ready to stop fighting with pixels and start working with data? Here is my exact, battle-tested process for extracting text from an image, making your edits, and generating a brand-new visual.
- Assess the source image quality: Before you begin, look at the image you want to modify. Is it a high-resolution export, or a heavily compressed, blurry JPEG? While modern AI is incredibly good at reading bad images, you will get better results if you can source the clearest version available. If the text is completely illegible to your own eyes, the AI might hallucinate words.
- Choose the right AI extraction tool: You need a multimodal AI model (like GPT-4o, Claude 3.5 Sonnet, or Google Gemini) that can process images. You can also use dedicated extraction features built into tools like InfoAIGraphic. Upload your image to the chat interface.
- Prompt the AI to identify structure, not just characters: This is the most critical step. Do not just ask the AI to “read the text.” You will end up with a messy paragraph. Instead, give it a prompt like this: “Analyze this image. Extract all the text and preserve the logical structure. If it is a table, output a markdown table. If it is a flowchart, output a numbered list showing the step-by-step progression. Do not summarize; give me the exact words used in the image.”
- Clean and format the extracted dataset: Once the AI gives you the text, copy it into a text editor. This is where you actually perform your “edits.” Did you want to change “Q3 Revenue” to “Q4 Revenue”? Do it here. Do you need to fix a typo from the original image? Fix it now. You are editing the raw data payload in a clean, distraction-free environment.
- Select the new visual framework: Look at your newly edited text. What is the best way to display this information? Just because the original image was a pie chart doesn’t mean your new version has to be. Perhaps the data makes more sense as a bar chart, a timeline, or a checklist. Choose the framework that best serves your current marketing goal.
- Input the clean data into an infographic generator: Now, take your edited, structured text and feed it into an AI infographic platform like InfoAIGraphic. Instruct the generator on how you want the data visualized. If you want a deep dive on prompting for visuals, read our How to create infographic with ai: Practical 2026 Guide.
- Apply your brand guidelines: The beauty of regenerating the image is that you are no longer tied to the colors and fonts of the original file. You can apply your own hex codes, typography selections, and logo. The text you just edited will be rendered natively in your brand style.
- Review for data accuracy and contextual flow: Always double-check the final output. Read through the text in the newly generated image to ensure your edits were applied correctly and that no data was dropped during the AI extraction phase.
- Export into a dynamic format: When you export from a modern platform, try to save the project in a way that allows future edits, rather than just downloading a flat PNG. This ensures the next person who needs to edit the text won’t have to start this process over.
- Distribute and iterate: Publish your new, typo-free, perfectly branded visual. Because you now have a dynamic workflow, if your boss asks for another text change tomorrow, you can execute it in two minutes instead of two hours.
Troubleshooting the Workflow
Even with incredible AI, things occasionally go wrong. When you are learning how to edit text in image files via extraction, you will run into a few common edge cases.
First, heavily stylized fonts can confuse the AI. If the original image uses a grungy, distressed font or extreme cursive, the extraction might substitute incorrect letters. Always proofread the extracted text before you start making your edits.
Second, ambiguous layouts can cause structural issues. If the original graphic is a chaotic web of overlapping text bubbles, the AI might not know which order to read them in. If the output comes back jumbled, you will need to manually rearrange the text blocks in your text editor to restore the logical narrative flow.
Finally, you might encounter issues where the regenerated graphic doesn’t quite capture the nuance of the original design. Remember, we are prioritizing agility and data accuracy over pixel-perfect cloning. If you find your generator is struggling to output the right layout, you might be facing a prompting issue. I wrote an extensive guide on fixing these exact problems; you can find it at Infographic workflow troubleshooting: Fix 6 Failures.
The Power of Data Storytelling
Once you master this workflow, you realize that you aren’t just fixing typos—you are engaging in high-level data storytelling.
When you extract text from a static, boring chart and regenerate it with clear, edited copy and fresh visuals, you give that data a voice. SAP [4] defines data storytelling as taking flat, numerical information and building a contextual narrative around it that people can grasp and relate to.
By taking control of the text inside your images, you control the narrative. You aren’t beholden to whatever the original designer thought was important. You can edit the headers to be more punchy. You can rewrite the bullet points to focus on the benefits for your specific audience.
ThoughtSpot [5] emphasizes that data storytelling bridges the gap between insight and impact, bringing together analysis, visualization, and thoughtful presentation. That is exactly what you are doing when you refuse to accept a flawed, static image and instead choose to regenerate a dynamic, text-edited masterpiece.
FAQ
Q: Can I just use a photo editor to edit text in a JPEG?
A: You can try, but it requires manually erasing the pixels, reconstructing the background, and matching the original font exactly. It is highly destructive, time-consuming, and usually results in a messy, noticeable patch job, which is why AI extraction is now the preferred method.
Q: Does artificial intelligence image to text work on handwritten notes?
A: Yes. Modern multimodal AI models are exceptionally good at reading handwriting from whiteboards, notebooks, or sketchpads. Once the AI extracts the handwritten text, you can edit it for clarity and generate a professional, digital graphic.
Q: Will I lose the original design if I use the extraction method?
A: Yes, you are fundamentally rebuilding the graphic rather than altering the original file. However, this is usually a massive advantage, as it allows you to update the visual to match your own current brand guidelines and ensure perfect image resolution.
Q: How do I handle charts where the text is intertwined with complex data lines?
A: Instead of trying to extract the text alone, prompt the AI to extract the underlying data table (the X and Y axes values). Once you have the raw data, you can edit the labels and feed the dataset into a tool like InfoAIGraphic to generate a clean, accurate new chart.
Conclusion
Learning how to edit text in image files doesn’t mean becoming a master of the clone stamp tool. It means fundamentally shifting how you view visual assets. Static pixels are a dead end. By leveraging multimodal AI to extract visual text, you gain the ability to edit, refine, and regenerate your data on demand.
The days of abandoning a great graphic just because of a single outdated number are over. With the right workflow, you can turn any static picture into a dynamic data visualization in minutes.
If you are ready to stop patching pixels and start generating beautiful, data-rich graphics at the speed of thought, give InfoAIGraphic a try. Your workflow—and your sanity—will thank you.


