Seo infographic strategy: Build Backlinks Faster Today
Use an seo infographic strategy to create linkable assets that earn quality backlinks, improve rankings, and drive compounding organic traffic. Discover how!

SEO Infographic Strategy: How to Build Backlinks Without a Designer
You know the feeling. You spend 15 hours researching and writing the “ultimate guide” for your industry. You hit publish, share it on LinkedIn, and wait for the traffic.
And then… nothing.
The content is good. The keyword research is solid. But nobody is linking to it.
In my experience running content teams and now building InfoAIGraphic, the missing piece often isn’t word count or keyword density—it’s visual linkability.
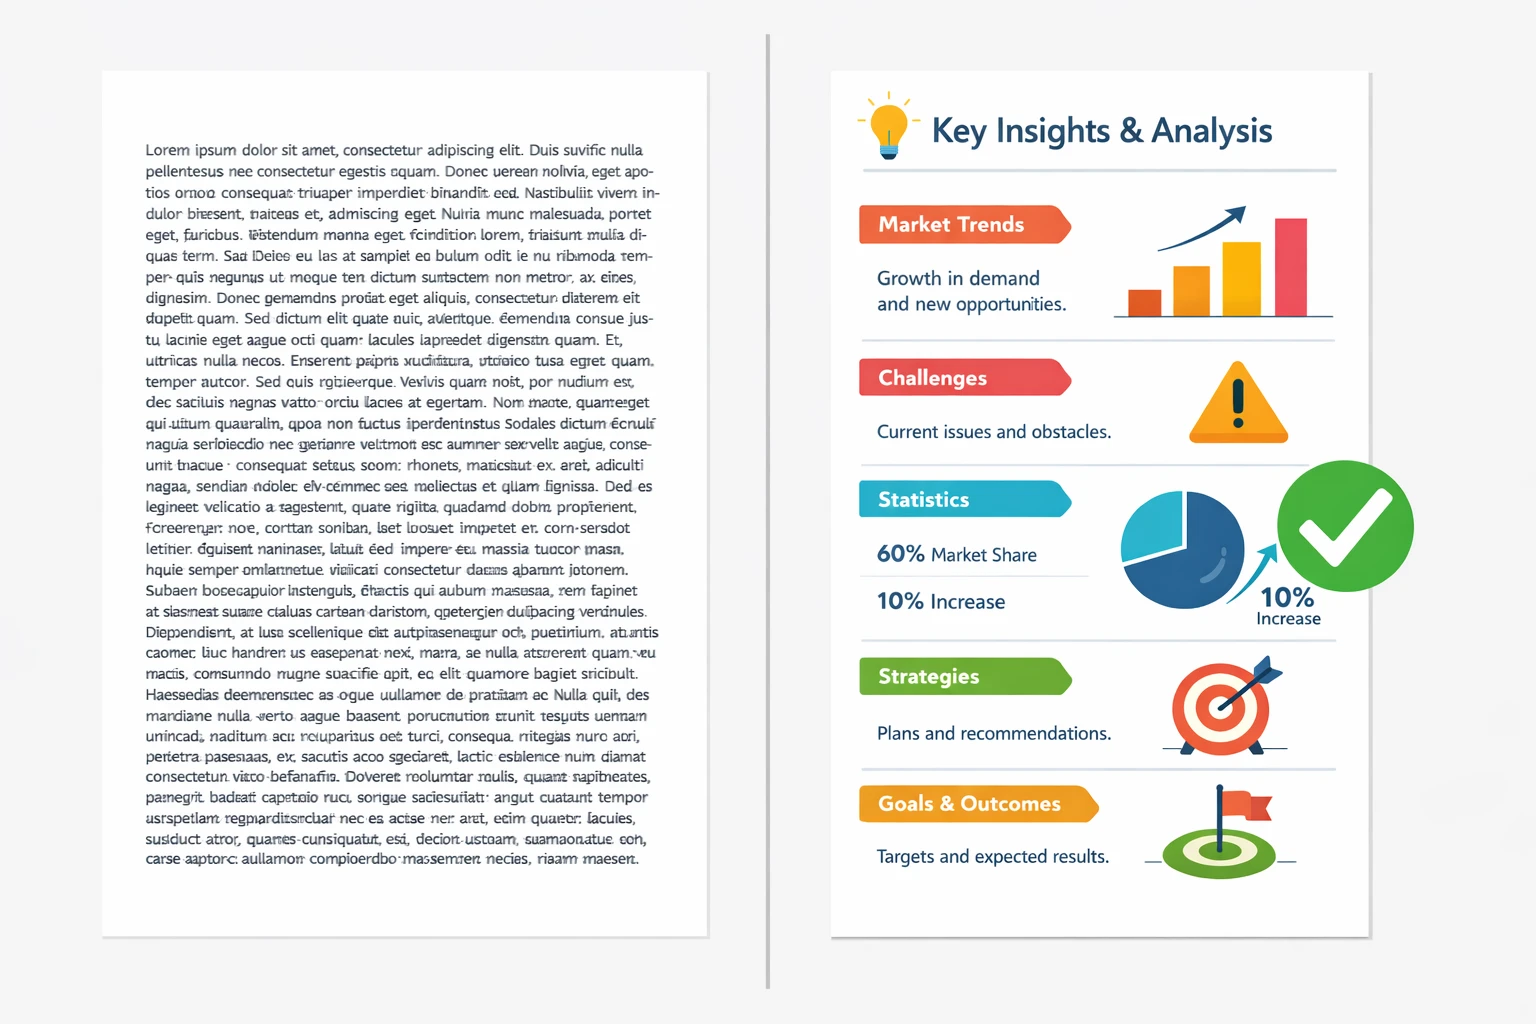
Here is the hard truth about modern SEO: other websites don’t like linking to walls of text. They link to assets that make their content look better. They link to charts, diagrams, and summaries that explain complex ideas quickly.
For years, creating these “linkable assets” required a $500 budget and a two-week wait for a designer. If you were a small team or a solo founder, you were priced out.
That has changed.
In this guide, I’m going to show you exactly how to execute an seo infographic strategy that earns backlinks and drives traffic, even if you have zero design skills.
Why an SEO Infographic is Your Best Link Building Asset
If you are new to this concept, you might be thinking, “Do infographics still work in 2026?”
The short answer is yes, but the style has changed. We aren’t talking about those towering, pixelated 5,000-pixel graphics from 2012. We are talking about dense, data-rich visuals that answer a specific question.
According to Backlinko’s analysis of 912 million blog posts, content with infographics generates 178% more inbound links than standard blog posts. That is nearly triple the link equity for the same topic.
Why does this happen?
- Visual Synthesis: B2B buyers are busy. A 2022 Demand Gen Report found that 62% of B2B buyers rely on infographics specifically during the early stages of their research because they need to digest data quickly.
- The “Embed” Factor: When another blogger writes about your topic, they need visuals to break up their text. If you provide a high-quality chart, they will “borrow” it and cite you as the source. That is the easiest backlink you will ever earn.
- Social Velocity: HubSpot’s marketing statistics consistently show that visual content is 40x more likely to be shared on social media than other types of content. More shares equal more eyeballs, which leads to more potential linkers seeing your work.
What Makes an Infographic “SEO-Friendly”?
I’ve seen teams throw a random stock photo into a blog post and call it “visual strategy.” That doesn’t work.
For an infographic to drive SEO results, it needs to satisfy a specific intent. It needs to be a reference.
In my own tests, the highest-performing seo infographics usually fall into one of these three buckets:
- The Aggregator: You curate stats from 10 different sources (citing them, of course) into one clean visual.
- The Simplifier: You take a complex process—like “How AI algorithms work”—and turn it into a step-by-step flowchart. (If you’re interested in this specifically, check out our guide on AI in Healthcare Infographic Guide).
- The Original Data: You survey your own email list or analyze your own internal data and visualize the findings.
Common Mistake: Don’t design for “pretty.” Design for “utility.” If the text on your graphic is too small to read on a mobile phone, Google’s algorithm (and your readers) will hate it.
Step-by-Step: How to Create an SEO Infographic Workflow
You don’t need Adobe Illustrator, and you don’t need a degree in data science. Here is the exact workflow I use to turn blog posts into link magnets.
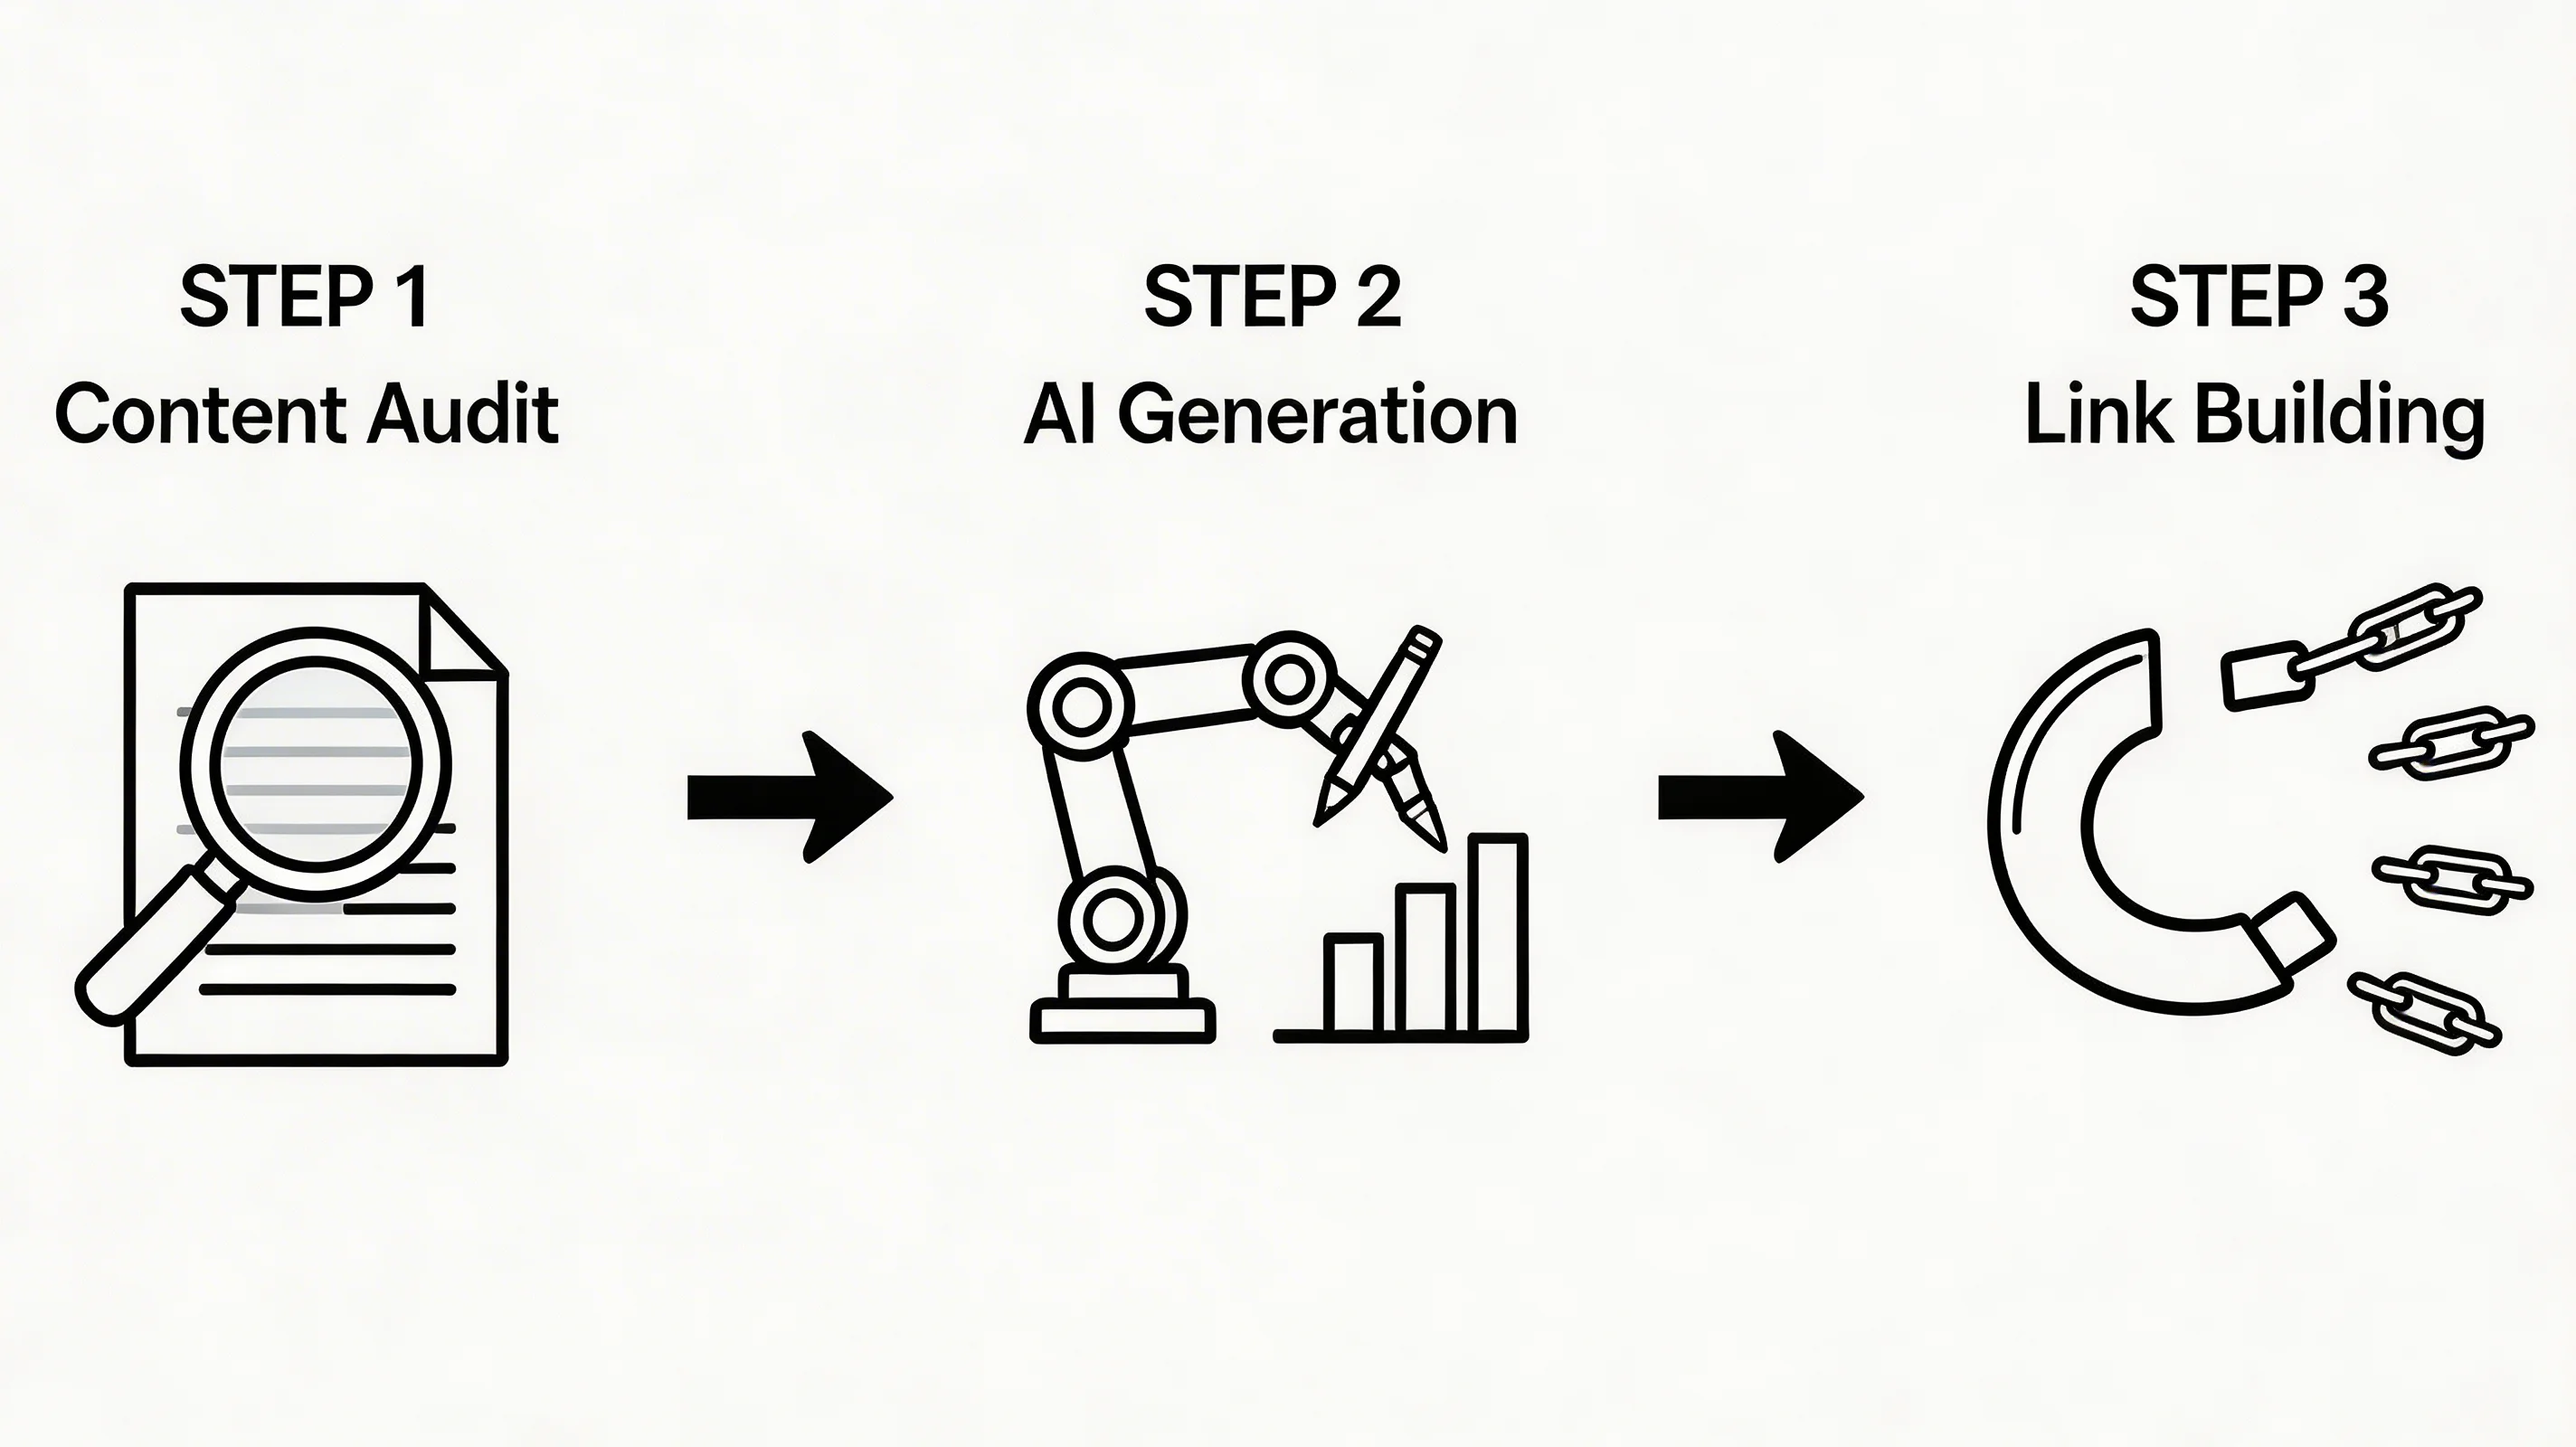
1. Audit Your Content for “Visual Opportunities”
Go to your Google Search Console. Look for pages that are ranking on page 2 or 3 (positions 11–30). These are your “striking distance” keywords.
Read through those articles. Look for paragraphs where you are listing stats, steps, or comparisons.
- “X vs Y” = Comparison Chart
- “Step 1, Step 2, Step 3” = Process Diagram
- “73% of marketers say…” = Data Highlight
2. Extract and Structure the Data
Once you’ve identified the section, strip it down to bullet points. An infographic cannot carry 1,000 words. It needs to carry the essence of the 1,000 words.
If you are struggling with how to structure this data for a visual format, our AI Tools for Infographic Creation guide breaks down how different tools handle data input.
3. Generate the Visual
This is where AI changes the game. Traditionally, you would wireframe this on a napkin and send it to a designer.
With tools like InfoAIGraphic, you can paste your text or data directly into the generator. The AI understands the context (e.g., “this is a comparison”) and selects a layout that fits the information structure.
Pro Tip: Keep your color palette consistent. If your brand uses blue and orange, don’t let the AI generate a pink and green chart. Consistency builds brand recognition when your graphic gets shared on other sites.
Ready to try this workflow? Try InfoAIGraphic free and turn your top article into an infographic in under 2 minutes.
4. Technical SEO Optimization (The Boring but Critical Part)
You cannot just upload a generic image and expect Google to find it. Search Engine Journal emphasizes that image context is a major ranking factor in 2025.
- File Name:
IMG_5920.pngis a wasted opportunity. Rename it toseo-infographic-link-building-strategy.webp. Use hyphens, not underscores. - File Format: Use WebP. It offers better compression than PNG or JPEG, which keeps your PageSpeed high—a critical Core Web Vital.
- Alt Text: Describe the image for accessibility and search engines.
- Bad: “Infographic about SEO.”
- Good: “Infographic showing a 5-step strategy for building backlinks using visual content, including data extraction and outreach.”
5. Publish with an “Embed Code”
This is the secret weapon. Underneath your infographic, provide a small HTML snippet that allows other people to copy and paste the image onto their site easily.
Include a “Source” link in that code pointing back to your original article. This ensures that when they use your image, you automatically get the attribution link.

Promotion: How to Get Eyes on Your Graphic
Publishing is only half the battle. Now you need to seed the content.
The “Guestographic” Method I learned this from the early days of SEO, and it still works.
- Find blogs that write about your topic but lack good visuals.
- Email them: “Hey, I loved your article on [Topic]. I actually made a detailed infographic about this exact data. innovative visual. Would you like to add it to your post? No charge, just thought it would add value for your readers.”
- If they say yes, send them the file and ask for a credit link.
It’s a value exchange. You give them free premium content; they give you a backlink.
Pinterest & Image Search B2B marketers often ignore Pinterest, but it is a search engine, not a social network. Upload your vertical infographics there with keyword-rich titles. It signals to Google that your content is visual and popular.
For more inspiration on what types of graphics perform well across different channels, check out our collection of AI Infographic Examples for Inspiration.
Troubleshooting: Why Isn’t My Infographic Ranking?
Sometimes you do everything right, and the results are slow. Here are the most common issues I see:
1. The File Size is Too Huge If your infographic is 5MB, it will kill your page load speed. Google will penalize the entire page. Always compress your images. Aim for under 200KB if possible, or lazy-load the image if it needs to be high-res.
2. The Data is Stale If you are visualizing stats from 2018, nobody will link to it in 2026. Orbit Media’s blogging statistics show that updating old content is one of the most effective SEO tactics. If your infographic is outdated, refresh the data and republish.
3. The Design is “Too AI” We have all seen those weird, hallucinations that generic AI image generators produce—misspelled text, six fingers, nonsensical charts. This destroys trust.
- Fix: Use specialized infographic tools (like InfoAIGraphic) that are programmed to render text and data accurately, rather than generic “art” generators. See our guide on AI infographic design for beginners for tips on maintaining quality control.
When NOT to Use an Infographic
Honesty time: not every post needs an infographic.
If you are writing a deeply personal opinion piece or a breaking news update, a chart might feel forced. Infographics shine when there is complexity to simplify or data to visualize.
Also, avoid infographics if you can’t verify the source of the data. Nothing kills your reputation faster than visualizing fake news.
Generate your first AI infographic from a blog post with InfoAIGraphic — no design skills required.
FAQ
Q: How long does it take to create an infographic with InfoAIGraphic? A: Typically, it takes about 2 to 5 minutes. You paste your content or URL, select a style, and the AI generates a layout. You might spend another few minutes tweaking colors or text, but compared to the 4-8 hours traditional design takes, it is significantly faster.
Q: Can AI-generated infographics actually rank in Google Images? A: Yes, absolutely. Google ranks images based on relevance, alt text, context, and engagement—not who (or what) created the pixels. As long as the information is accurate and the file is optimized for SEO (filename, alt text, file size), it has the same ranking potential as a human-made graphic.
Q: Is an seo infographic suitable for content repurposing? A: It is one of the best formats for this. One infographic can be sliced into 4-5 social media posts (LinkedIn carousels, Instagram posts), included in email newsletters to boost click-through rates, and used as a thumbnail for video content.
Q: Do I need to be a designer to use AI infographic tools? A: No. The entire purpose of tools like InfoAIGraphic is to democratize design. The AI handles the hierarchy, spacing, and layout rules that designers usually study for years. You just need to be the “editor” who approves the content.
Q: How many infographics should I include in a blog post? A: One high-quality “hero” infographic is usually enough to earn links. However, Orbit Media suggests that posts with 7+ images (mixed visuals) tend to perform best. So, combine your main infographic with smaller charts or screenshots throughout the article.
Conclusion
The era of text-only SEO is fading. As search engines evolve with AI overviews and rich snippets, they are prioritizing content that answers questions quickly and visually.
An seo infographic strategy isn’t just about making your blog look pretty. It’s about creating an asset that other people want to share. It transforms your content from a passive reading experience into an active tool for growth.
You don’t need a big budget. You don’t need a design team. You just need to spot the data in your content and give it a visual form.
If you are ready to turn your existing blog posts into visual link magnets, I invite you to give InfoAIGraphic a try. We built it specifically to solve this problem for founders and marketers like you.
Share this article

Mateoo
Founder of InfoAIgraphic
Building the fastest way to turn text into viral infographics. Helping creators and businesses scale their visual content without design skills.
Related Articles

Why Your Current SEO Report Template Is Failing (And How Visual Reporting Fixes It)
Stop sending boring spreadsheets. Discover the ultimate SEO report template strategy to scale your visual content and build automated visual SEO reporting

YouTube Video Summarizer API Key: The Founders Guide to AI Infographics
Discover how a YouTube video summarizer API key transforms long content into stunning AI infographics. Learn workflows, prompt engineering, and visual data
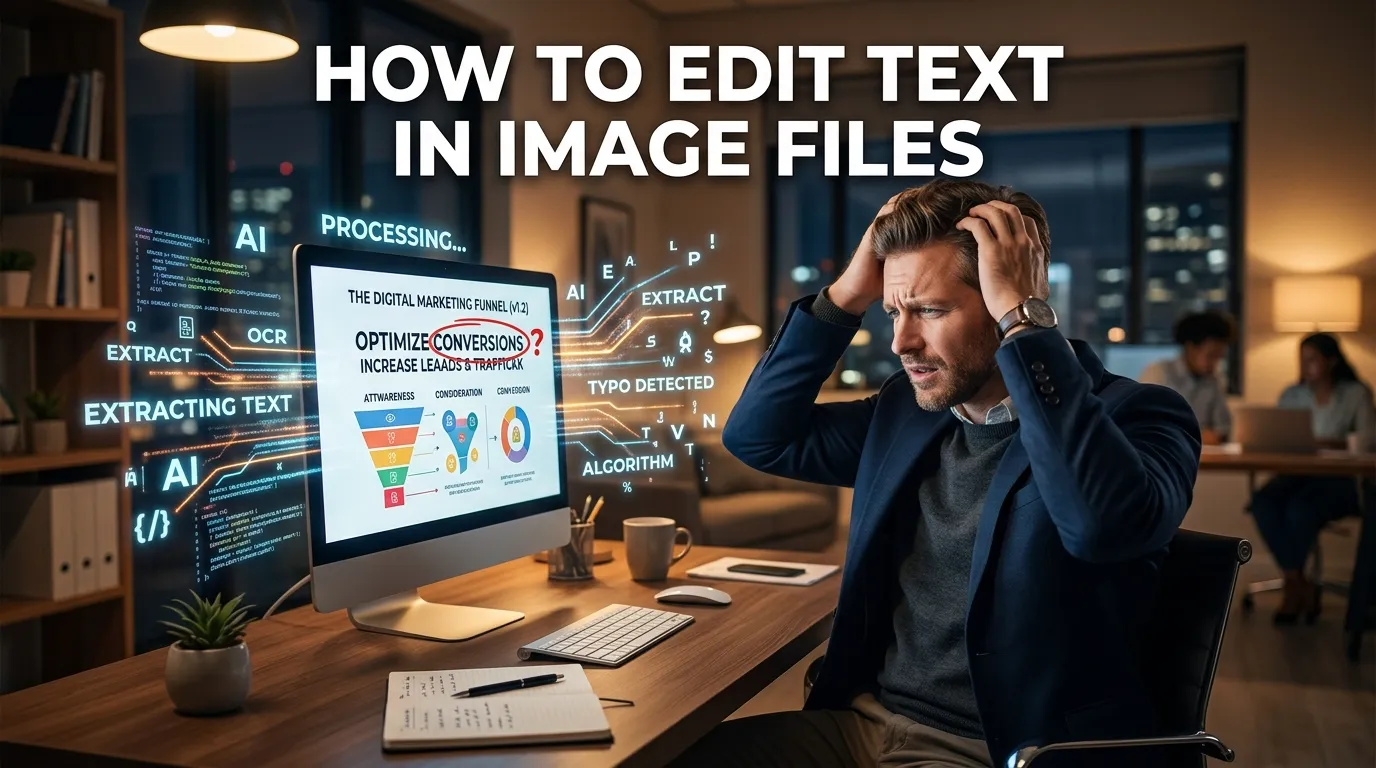
How to Edit Text in Image Files: The Founder’s Guide of Infographic Design 2026
Learn how to edit text in image files using AI. Discover how marketers extract data from static visuals and turn them into dynamic, stunning infographics.