Add your content
Start with public articles, blog posts, and pasted drafts and remove anything that should not appear.
Blog to infographic
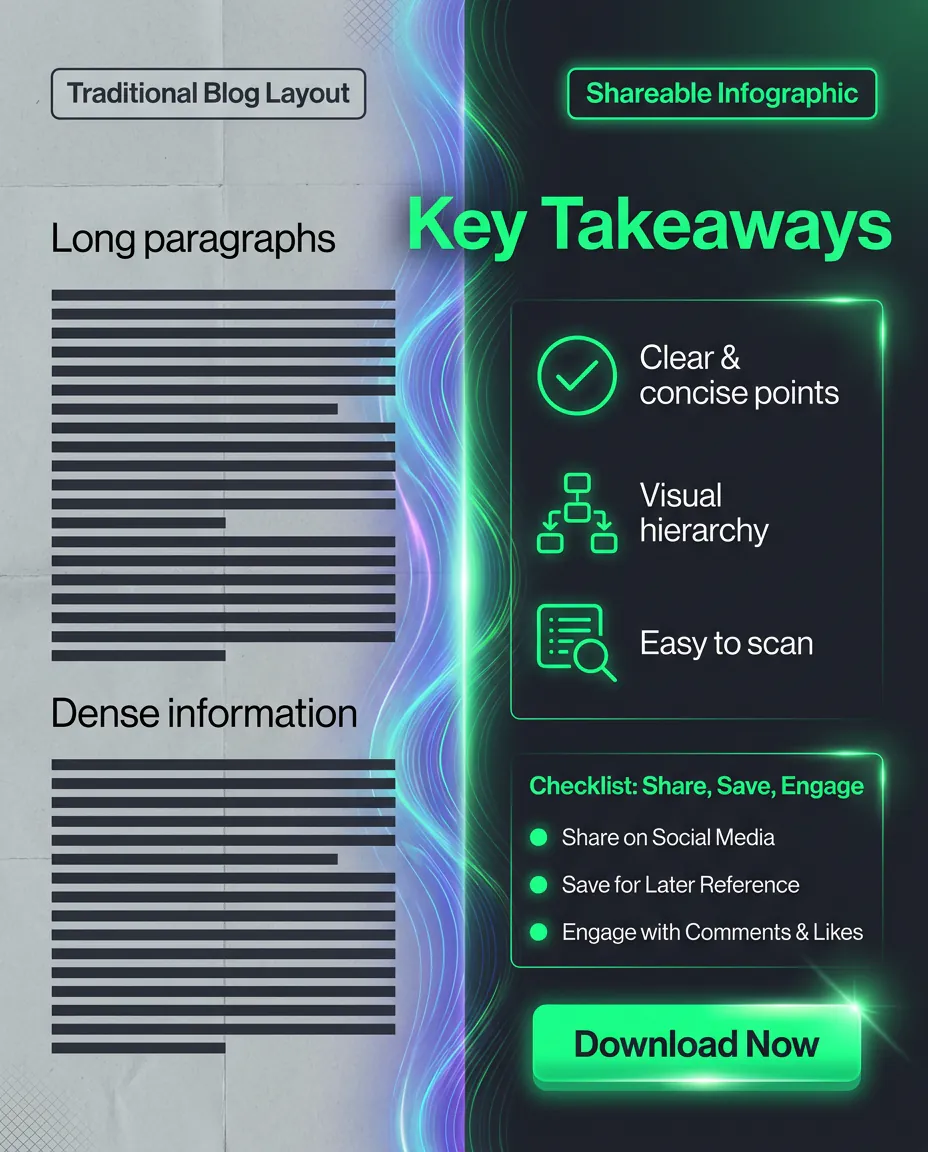
Provide a supported public URL or paste the article text, review what was extracted, and focus the infographic on one clear takeaway rather than the entire post.
Five introductory credits. No subscription.
How it works
Start with public articles, blog posts, and pasted drafts and remove anything that should not appear.
Select the model, infographic type, style, and aspect ratio available to your account.
Check every heading, number, and visual relationship before publishing or downloading.
Practical value
infoAIgraphic creates an image, not an editable design document. Clear source material and human review remain essential.
Build from content that already has a message and supporting details.
Focus on a list, comparison, process, or set of key statistics.
Create a visual companion for social, email, or the original article.
Use cases
Give readers a quick visual overview.
Adapt one idea for another distribution channel.
Visualize a framework or point of view.
Questions
No. The article must be publicly accessible and allow extraction. When a URL cannot be processed, paste the relevant article text directly.
No. Creation credits do not expire, and infoAIgraphic does not require a subscription. New accounts currently receive five introductory credits to test the workflow.
Yes. Always check names, numbers, citations, and wording against the original source before publishing. AI-generated visuals can require another generation when the first layout is not suitable.
Start with your content