Add your content
Start with slide notes, pitch outlines, and lesson content and remove anything that should not appear.
Presentation infographic
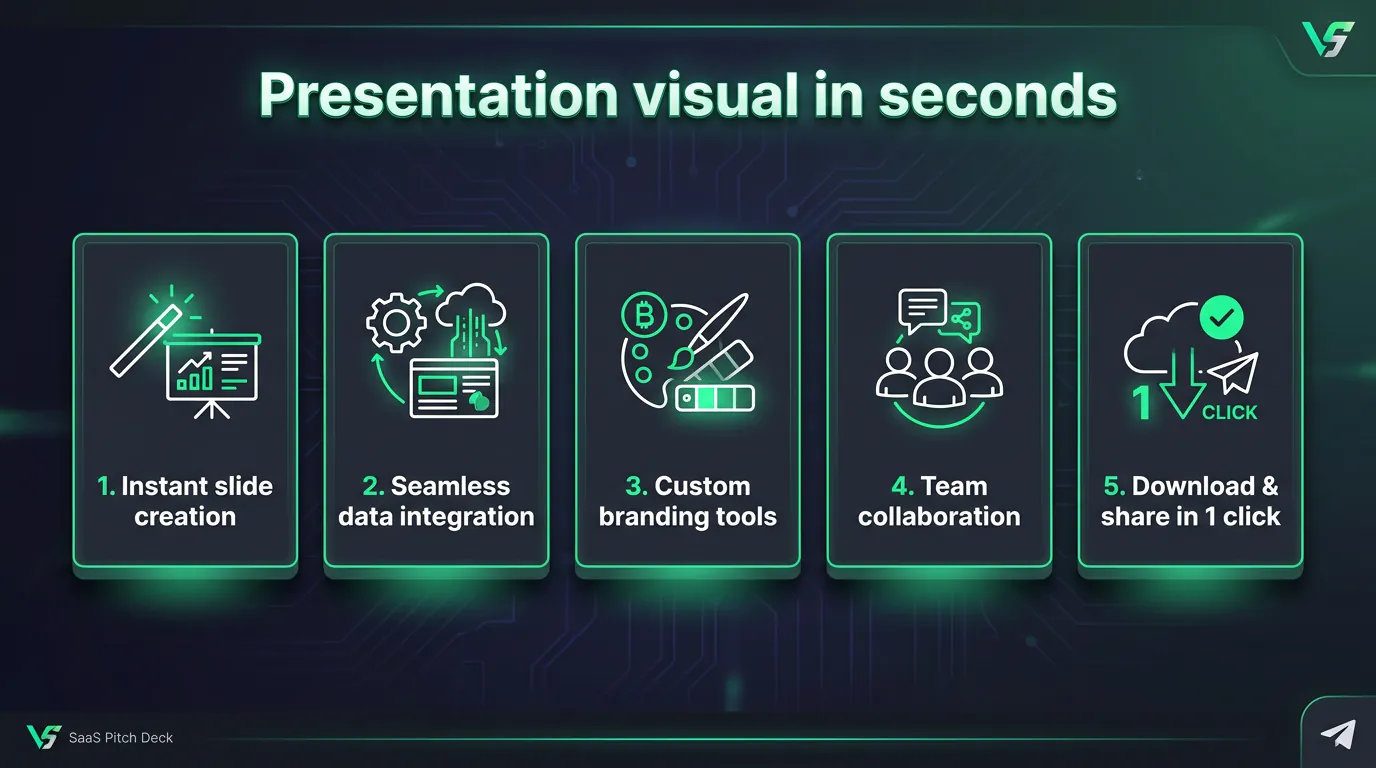
Paste the central message, supporting points, and any required data. Generate a visual summary for a meeting, lesson, pitch, or talk rather than an editable slide deck.
Five introductory credits. No subscription.
How it works
Start with slide notes, pitch outlines, and lesson content and remove anything that should not appear.
Select the model, infographic type, style, and aspect ratio available to your account.
Check every heading, number, and visual relationship before publishing or downloading.
Practical value
infoAIgraphic creates an image, not an editable design document. Clear source material and human review remain essential.
Reduce a long outline to the points the audience needs to remember.
Create a visual that complements the presenter instead of repeating every word.
Choose a landscape, portrait, square, or standard aspect ratio.
Use cases
Show decisions, priorities, or metrics.
Explain a concept with a clear hierarchy.
Visualize a process, comparison, or opportunity.
Questions
No. It generates an infographic-style image that can support a presentation. It does not create a native PowerPoint or Google Slides file.
No. Creation credits do not expire, and infoAIgraphic does not require a subscription. New accounts currently receive five introductory credits to test the workflow.
Yes. Always check names, numbers, citations, and wording against the original source before publishing. AI-generated visuals can require another generation when the first layout is not suitable.
Start with your content