Input text
A messy paragraph from a meeting or blog draft
Text does not need to be polished. The stronger the idea, the easier it is to turn into a useful visual.
- Meeting notes
- A blog draft
- Raw bullets
- A framework
- A process description
No subscription. Pay only for HD exports.
Paste messy notes, bullets, paragraphs, or a draft. The app turns your text into a visual summary with structure, sections, and a clear takeaway.
Secure Stripe checkout. Credits never expire. Commercial HD exports available.
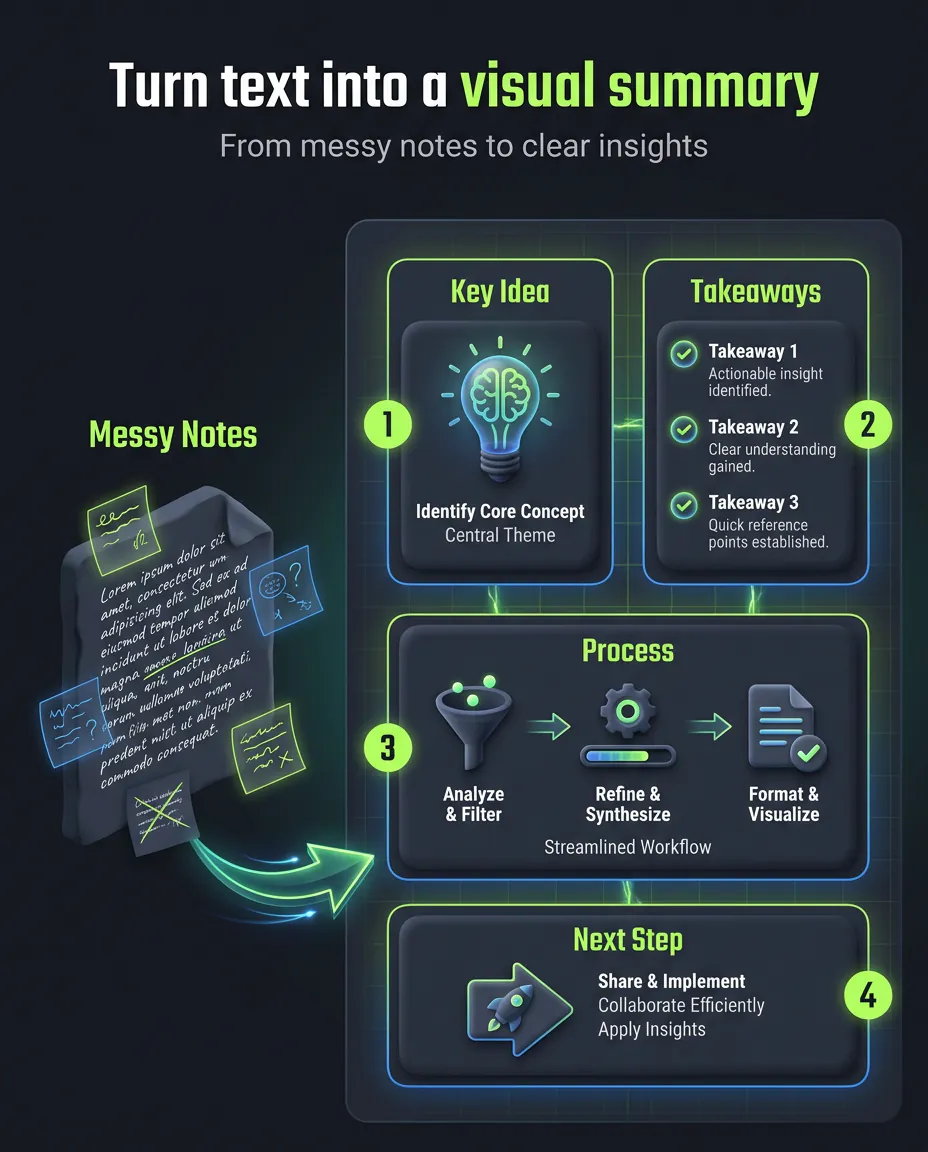
Text to infographic example showing messy notes transformed into a structured visual summary.
Input text
Text does not need to be polished. The stronger the idea, the easier it is to turn into a useful visual.
Visual summary
The result turns the text into a headline, key takeaways, visual sections, and a next step.
text to infographic
A text to infographic generator helps you convert written content into a visual summary. It is useful when you have notes, paragraphs, outlines, or draft copy but do not know how to structure it visually. Instead of manually rewriting the text, choosing a layout, and adjusting every section in a design tool, infoAIgraphic creates a preview you can review first. Use it for checklists, process guides, comparisons, educational summaries, social visuals, and presentation inserts.
A simple path from source material to a professional HD export.
Paste text, add a link, upload a document, or bring in the notes you already have.
Pick the structure that fits the job: summary, checklist, timeline, comparison, or presentation visual.
Review the draft first so you can see whether the structure, hierarchy, and message are useful.
Pay only when you want the polished export for publishing, client work, presentations, or commercial use.
These pages should rank because they solve specific source-to-visual workflows, not because they repeat generic AI copy.
Turn scattered decisions and action items into a recap people will actually read.
Pull the main ideas from a draft and create a visual companion for the post.
Transform a model, method, or playbook into a visual people can remember.
Convert instructions or requirements into a practical list for teams, clients, or students.
Repurpose written ideas into graphics for LinkedIn, newsletters, or community posts.
Make internal documentation easier to scan by turning the core steps into a visual guide.
Choose a format that matches the way your source material should be understood.
Compress the most important points into a clean visual your audience can scan quickly.
Turn instructions, requirements, or action items into a practical list people can follow.
Show a process in order without forcing readers through a long paragraph.
Map milestones, stages, or historical context into a clear sequence.
Make tradeoffs, options, or before-and-after stories easier to understand.
Pull out the handful of ideas that deserve to become a social post, slide, or handout.
Create a slide-ready graphic for decks, webinars, workshops, or lessons.
Repurpose source content into a visual that fits LinkedIn, newsletters, and short-form distribution.
Meeting recap
Turn these meeting notes into a one-page infographic with decisions, blockers, and next steps.
Blog draft
Convert this blog section into a visual summary with 5 key takeaways.
Checklist
Create a checklist infographic from this onboarding process.
Comparison
Turn this paragraph into a two-column comparison infographic.
Framework
Create a step-by-step infographic that explains this framework to beginners.
Social
Summarize these bullets as a LinkedIn-ready vertical infographic.
Create a free preview before you spend anything. When the result is useful, use credits for the professional HD export with no watermark and commercial use.
Generate free previewCreate professional infographics from ideas, text, PDFs, reports, links, and videos.
Convert PDFs, reports, research notes, and whitepapers into visual summaries.
Turn YouTube videos, webinars, tutorials, and transcripts into infographic recaps.
Create slide-ready visuals from talking points, outlines, lessons, and pitch notes.
Turn reports, analytics, research, and business updates into executive visual summaries.
Repurpose blog posts, articles, and URL content into shareable infographic previews.
Clear notes, bullets, outlines, and short sections work best. Long unstructured text can work too, but results improve when the main idea is visible.
Yes. Paste the paragraph and ask for a summary, checklist, process, or comparison format.
No. You can preview for free and pay only when you choose an HD export.
Yes. Text-to-infographic workflows are useful for LinkedIn posts, carousels, newsletters, and quick visual explainers.
You can regenerate when you want another structure or visual direction before exporting the final HD asset.
No. Infographics work best when they prioritize the most important ideas. Review the preview before export.
Paste your source material, check the preview, and export HD only when the visual is useful enough to keep.
Generate free preview